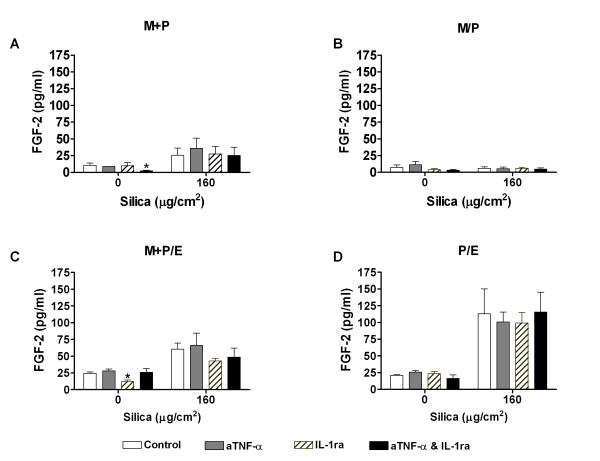
Figure 5.
The effect of anti-TNF-α (aTNF-α) and/or IL-1 receptor antagonist (IL-1ra) on FGF-2 release. The contact and non-contact co-cultures (M+P, M/P, M+P/E and P/E) were exposed to silica (160 μg/cm2) for 43 h. Contact is symbolised by "+" and non-contact by "/". Data represent means ± SE for n = 3 separate experiments. *P < 0.05 shows statistical differences of co-cultures pre-treated with anti-TNF-α and/or IL-1ra vs. untreated co-cultures. #P < 0.05 shows statistical differences of co-cultures pre-treated with anti-TNF-α or IL-1ra alone vs. co-cultures pre-treated with anti-TNF-α and IL-1ra in combination. Data were log-transformed before performing ANOVA.

