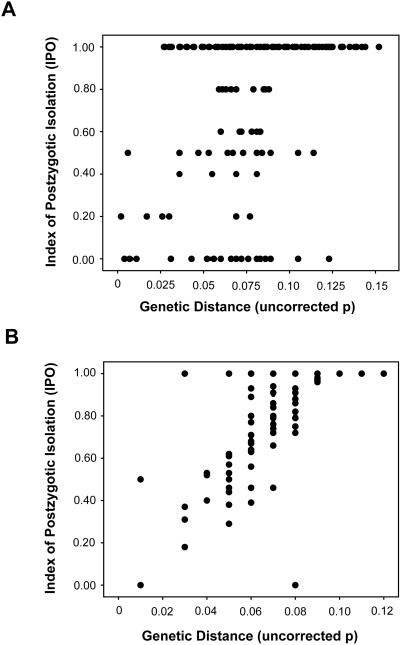
Figure 1. Scatterplot of postzygotic isolation indices and genetic distance (uncorrected p) of (A) the entire dataset (rs = 0.406, N = 680, P<0.001), and (B) corrected for phylogenetic independence (rs = 0.538, N = 101, P<0.001).
Both show that postzygotic reproductive isolation increases with increasing genetic distance.

