
Fig. 10.
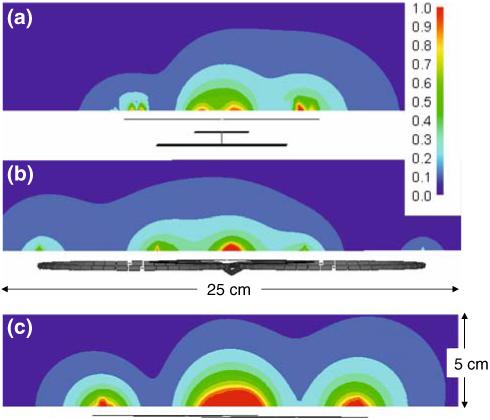
SAR (watts/kg, color scale upper right) values in the axial plane where the peak SAR averaged over 1 g of sample (red square) occurs for the three quadrature elements: a phi-coil, peak SAR=3.7 watts/kg at (x =∼ 0, y = 0, z = -50mm) b figure-8 plus loop, peak SAR=3.7 watts/kg at (x = 0, y = 0, z = -40mm) and c overlapped loops, peak SAR=3.2 watts/kg at (x = 0, y = 0, z = -30mm) in transmit mode in the Agar gel phantom (εr = 78 and σ = 0.45 S/m). The input power at each element is applied to generate ∼2 μT at a depth of 90 mm with a 10% duty cycle. The detector profiles are sketched below each plot