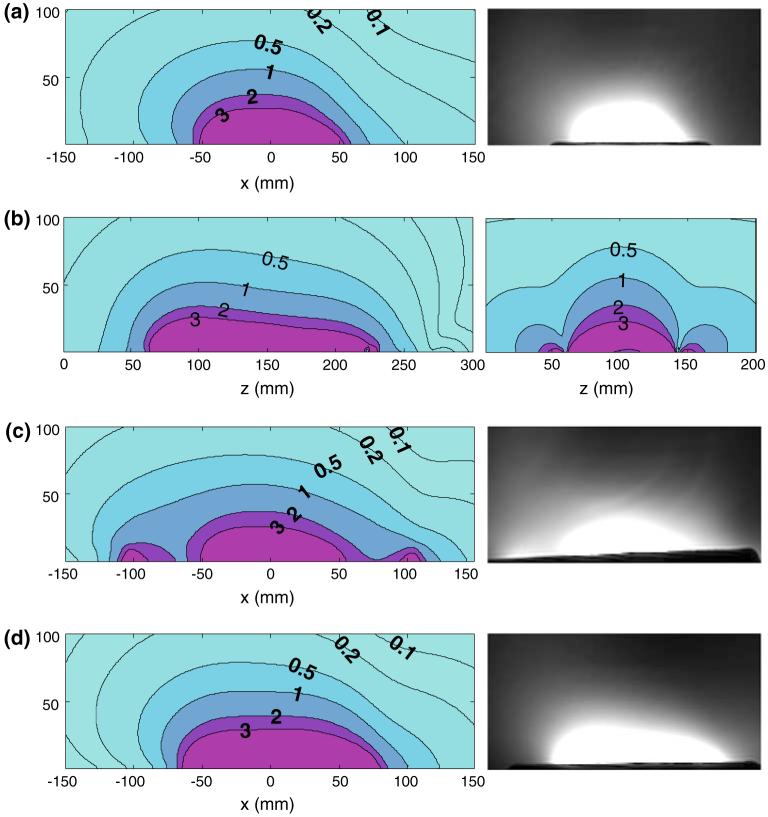
Fig. 6.
Numerical ISNR contour profiles and experimental image profiles of surface quadrature detectors: a on the left the axial ISNR contour profile of the phi-detector (strip length, 200 mm; strip width, 25 mm; circular loop radius, 40 mm) and on the right the experimental image profile; b on the left the sagittal ISNR contour profile of the phi-detector and on the right the sagittal ISNR contour profile of the figure-8 plus loop (figure-8 radius, 52mm; circular loop radius, 40 mm); c on the left the axial ISNR contour profile of the figure-8 plus circular loop coil and on the right the experimental image profile; and d on the left axial ISNR contour profile of overlapped dual loop array (circular loop radii, 40 mm) and on the right the experimental image profile. Contour intervals are in arbitrary units

