Figure 5.

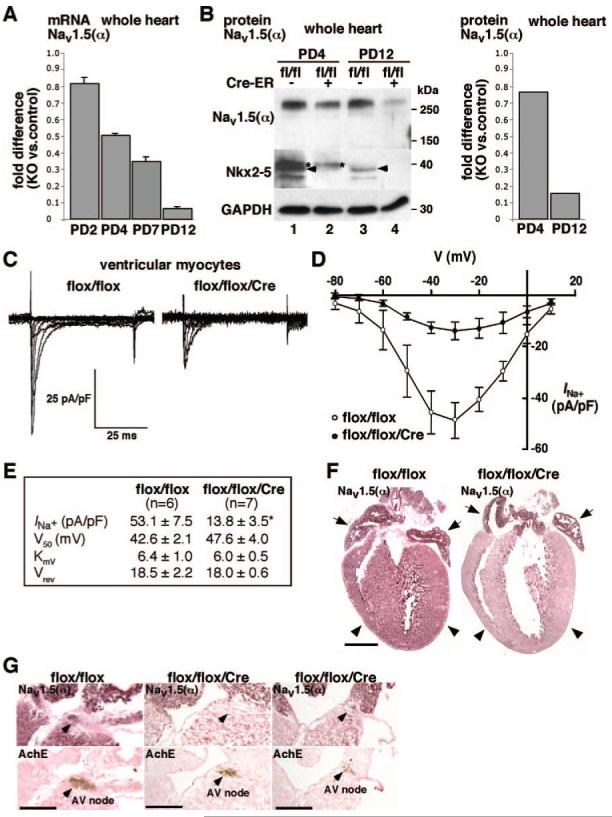
Reduced expression of Nav1.5 α-subunit and reduced INa in Nkx2-5 knockout ventricles. A, Real-time RT-PCR demonstrates progressive reduction of Nav1.5(α) mRNA at PD2, PD4, PD7, and PD12. B, Western blotting demonstrates progressive reduction of Nav1.5(α) protein at PD4 and 12 (lanes 1 vs 2 and 3 vs 4). Fold difference compared to control hearts normalized to GAPDH is shown in right image. Nkx2-5 proteins (arrowheads) are below the level of detection in flox/flox/Cre mice at PD4 and PD12 (arrowheads). C, Representative INa trace recordings from cardiac myocytes obtained from flox/flox (left) and flox/flox/Cre mice (right) using 10 mmol/L Na+ as charge carrier. Myocytes were maintained at -110 mV holding potential with stimulation to -80 to +10 mV at 10-mV steps for 100 ms at 0.1 Hz. D, Current-voltage relation plot for INa in flox/flox (n=6) and flox/flox/Cre (n=7) myocytes, total 7 to 8 days after tamoxifen injections. INa are normalized by cell capacitance and presented as mean±SE. E, Table of kinetic values with maximal current density obtained at -30-mV stimulation. V50, obtained from steady-state activation analysis is the voltage potential determined to elicit the half-maximal INa; KmV is the slope factor; and Vrev is the reversal potential for INa. F, Immunostaining of Nav1.5(α) demonstrates reduced Nav1.5(α) protein in ventricles from Nkx2-5 knockout mice (right images, arrowheads) but preserved expression in atria at PD12 (right images, arrows). Scale bar=1 mm. G, Immunostaining of Nav1.5(α) protein (top) and acetylcholine esterase staining in adjacent tissue sections (bottom). In flox/flox mice, part of AV node is positive for Nav1.5(α) (left images). In flox/flox/Cre mice, serial sections including AV node demonstrate Nav1.5(α) staining absent in the section shown in middle images but is present at a limited part of AV node in the section shown in right images. Scale bars=500 μm. *P<0.01.
