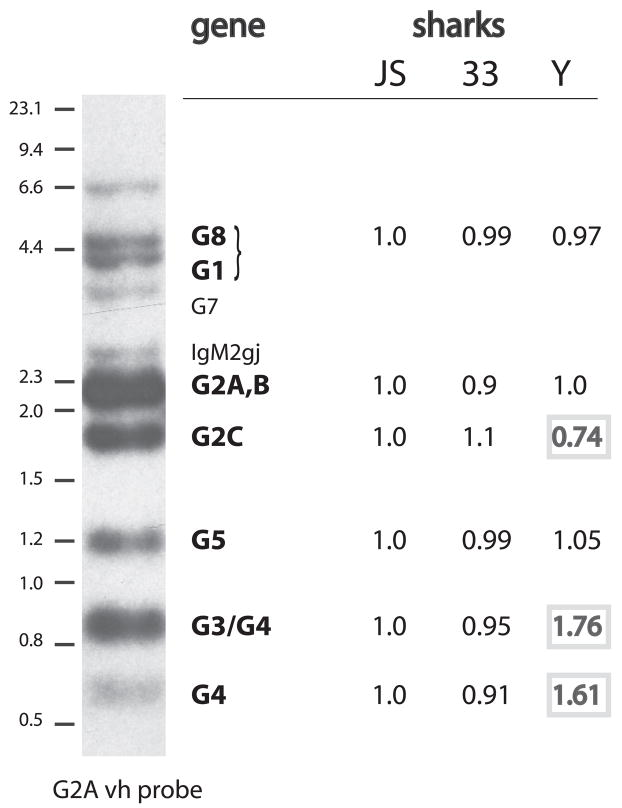
FIGURE 5.
Comparison of VH gene content in three individuals by genomic Southern blotting. Erythrocyte DNA from shark-JS, -33, and -Y were digested with HincII and electrophoresed on a 1.2% agarose gel. The DNA was transferred to nylon filters and hybridized to a RAG1 probe to check for the comparative amounts of DNA present. The blot was scanned and analyzed by using a PhosphorImager; and the RAG1 signal at ca. 3.5 kb in each of the three lanes was quantitated in PhosphoImager units. The unit values of all three were divided by that of shark-JS, so that the shark-JS RAG-1 score is 1, while shark-33 was 1.17 and shark-Y, 1.1. These scores (1, 1.17, 1.1) were taken as reflecting the relative amounts of DNA transferred to the blot and used to adjust for comparative scoring of vh-hybridizing bands. The same blot was hybridized with the vh probe (Materials and Methods) and scanned. Six areas were quantitated in each lane (G8+G1, G2A/B, G2C, G5, G3+G4, and G4). A conventional x-ray autoradiographic example (shark-JS) of the spectrum of genomic bands is shown at the left, with size markers (λ HindIII and 100 bp marker, NEB) and all the bands identified except the one at 6.6 kb. Genes not observed include IgM1gj, at ~1 kb, which is not detected under the hybridization conditions. The value readings obtained from PhoshorImager analysis of the vh-hybridized blot were processed the following way. For instance, Shark-33 G5 score (0.99 at 1.2 kb) was derived from: [shark-33 G5 value ÷ 1.17] ÷ Shark-JS G5 value. Shark-Y G5 score (1.05 at 1.2 kb) was derived from Shark-Y G5 value ÷ 1.1] ÷ Shark-JS G5 value. Resulting scores differing by >20% are bold faced.

