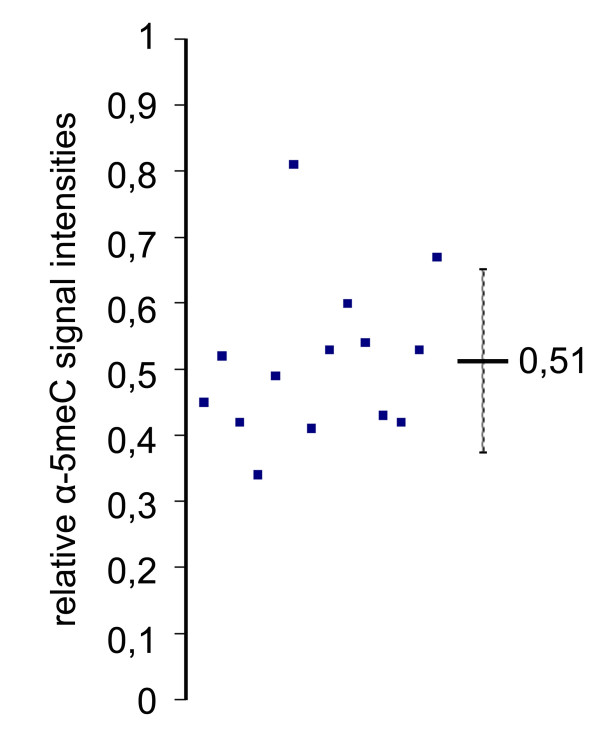
Figure 3.
Quantification of the relative α-5meC signal intensities in paternal pronuclei of rabbit zygotes. The graph shows the relative α-5meC/DNA paternal to maternal signal intensities ratios for 14 individual PN3-4-stage zygotes. The ratio describes the amount of the remaining paternal methylation compared to maternal (set as 1). The mean value is 0.51, standard deviation is 0.139.

