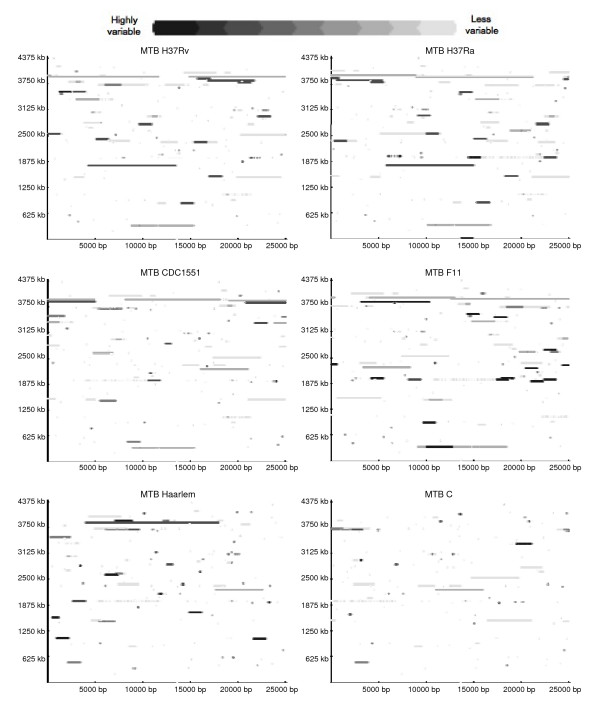
Figure 2.
Distribution and frequency of LSPs in strains H37Rv, H37Ra, CDC1551, F11, Haarlem and C. The picture depicts LSP sites observed for each of the six strains (MTB H37Rv, H37Ra, CDC1551, F11, Haarlem and C) with respect to the other strains. The frequency of the LSP can be inferred from the color scale. Background color represents invariable positions. The base of the square is 25,000 bp and the sizes of the LSPs are proportionately scaled.

