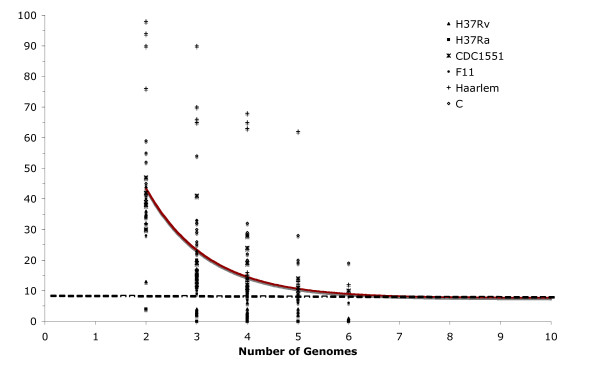
Figure 3.
Extrapolation of strain-specific deletions. The number of specific deletions is plotted as a function of the number n of strains. For each n, markers are the 6!/[(n - 1)!·(6 - n)!] values obtained for the different strain combinations. The continuous curve represents the least-squares fit of the function Fs(n) = κs exp [-n/τs] + Ω, where κs = 186.7 ± 44.3, -1/τs = -0.83 ± 0.13 and Ω = 7.6 ± 1.7. The best fit obtained had a correlation of 0.997.

