
Figure 5.
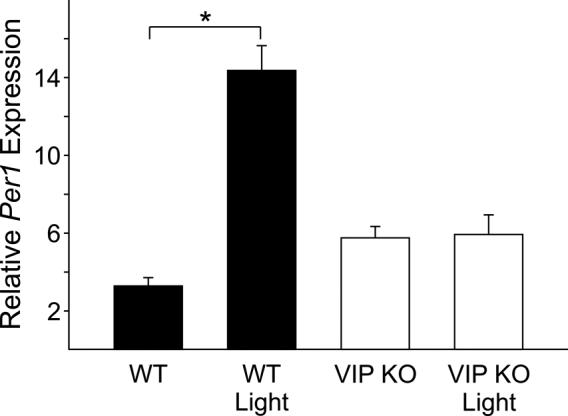
Photic induction of Per1 in the adrenal glands. 60 min after the start of the light treatment in early night (CT16; 15μW/cm2, 30 minute duration), adrenal glands were removed for RNA analysis by quantitative RT-PCR. Expression levels of Per1 were normalised to Hprt using the 2−ΔΔCt method. WT mice showed a significant increase in relative Per1 expression (baseline: 3.29±0.43, n=4; vs. light pulse 14.37±1.27, n=4; P<0.001). VIP KO mice did not show a significant increase in Per1 expression (baseline: 5.76±0.59, n=4; vs. light pulse 5.93±1.01, n=4).