Figure 4.
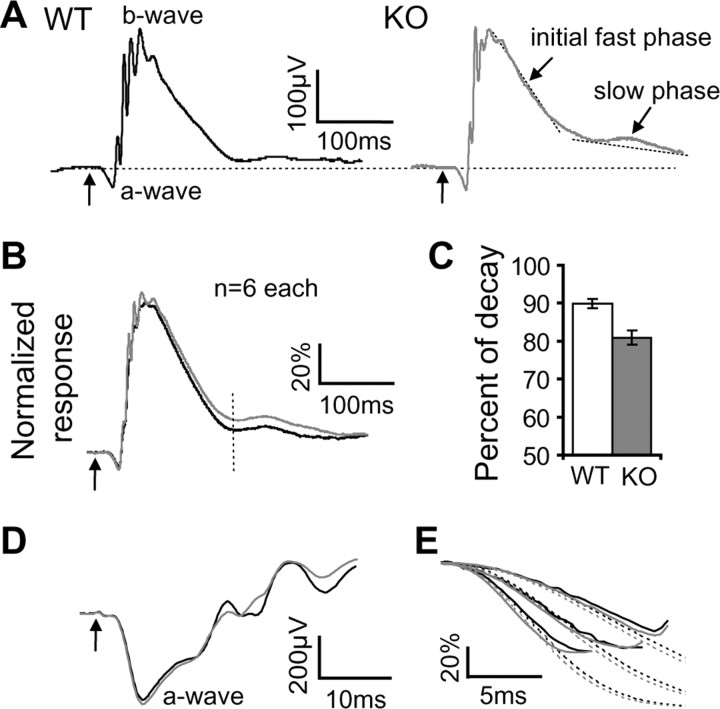
The falling phase of the b-wave of the ERG is slower in the PCP2-null mouse than in the wild type. A, ERG responses of dark-adapted WT and PCP2-null (KO) mice to a strong 10 ms light flash (31 R*/rod/flash). The arrows in all panels denote the onset of light stimuli. B, Averages of normalized b-waves of the wild-type (black trace) and PCP2-null (gray trace) mice. The rising phase and the initial fast falling phase of the null mouse resembled those of the wild type. However, the second falling phase in the null mouse was slower than in the wild type. C, To measure decay of the ERG response, the amplitude of the b-wave was measured at 150 ms after its peak (B, vertical dashed line). In wild type, this amplitude decayed by 90% of the peak (where 100% is peak to baseline), whereas in null mice, it decayed by only 81% of peak (n = 6 animals each; Mann–Whitney test, p < 0.001). Error bars indicate SEM. D, Expanded, averaged a-waves of wild-type and null mice to saturating light (10,000 R*/rod) looks similar. E, An example of normalized ERG a-wave component (solid lines) from a wild-type (black) and a null mouse (gray) fitted with the transduction cascade activation model (dotted lines). The three responses to flashes of 870, 1800, and 3600 R*/rod were fitted simultaneously with Equation 1 with the least-squares method.

