Figure 6.
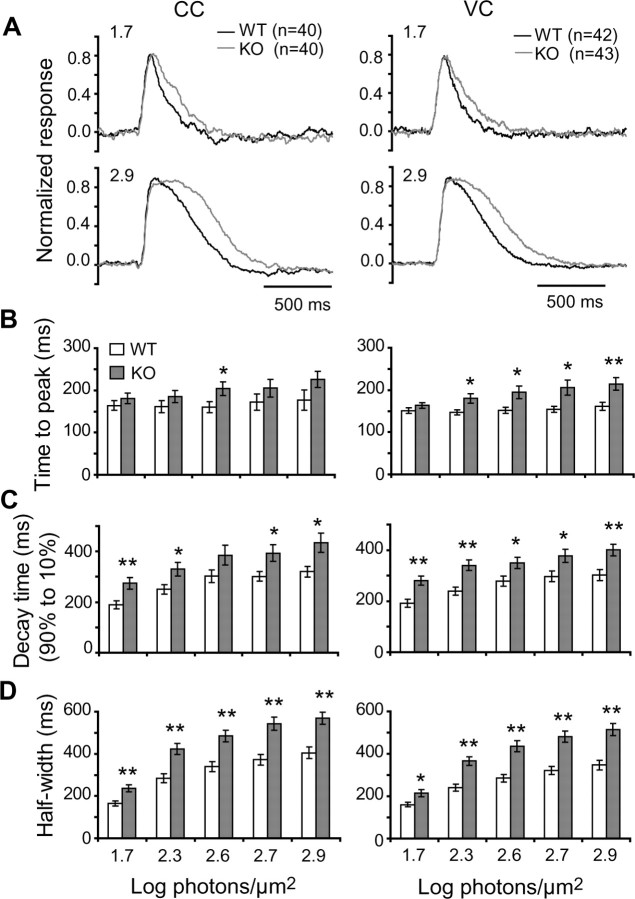
PCP2 accelerates the light response of rod bipolar cells at different light intensities. A, Averages of normalized responses of bipolar cells (number given by n) to two light intensities (indicated above the traces in log photons μm−2) under current clamp (CC) (left) and voltage clamp (VC) (right). The responses of the wild-type bipolar cells (black traces) decay faster than those of the null cells (gray traces), with a more pronounced effect at the saturating intensity. B–D, Data were quantified from current-clamp (left) and voltage-clamp (right) experiments; data were significantly different between WT and KO (ANOVA). The asterisks indicated a significant difference between wild-type and PCP2-null cells at a particular intensity (Student's t test; *p < 0.05, **p < 0.005). B, The time between stimulus onset and response peak (time to peak) tended to be shorter for wild-type than for null cells. The difference was significant when measured with voltage clamp (right; p < 0.005). C, The decay time from 90 to 10% of the peak was shorter for wild-type than for null cells under both current clamp and voltage clamp (p < 0.01). D, The half-width of the peak was significantly shorter for wild-type than PCP2-null cells at most light intensities (p < 0.001 for both current clamp and voltage clamp). Error bars indicate SEM.

