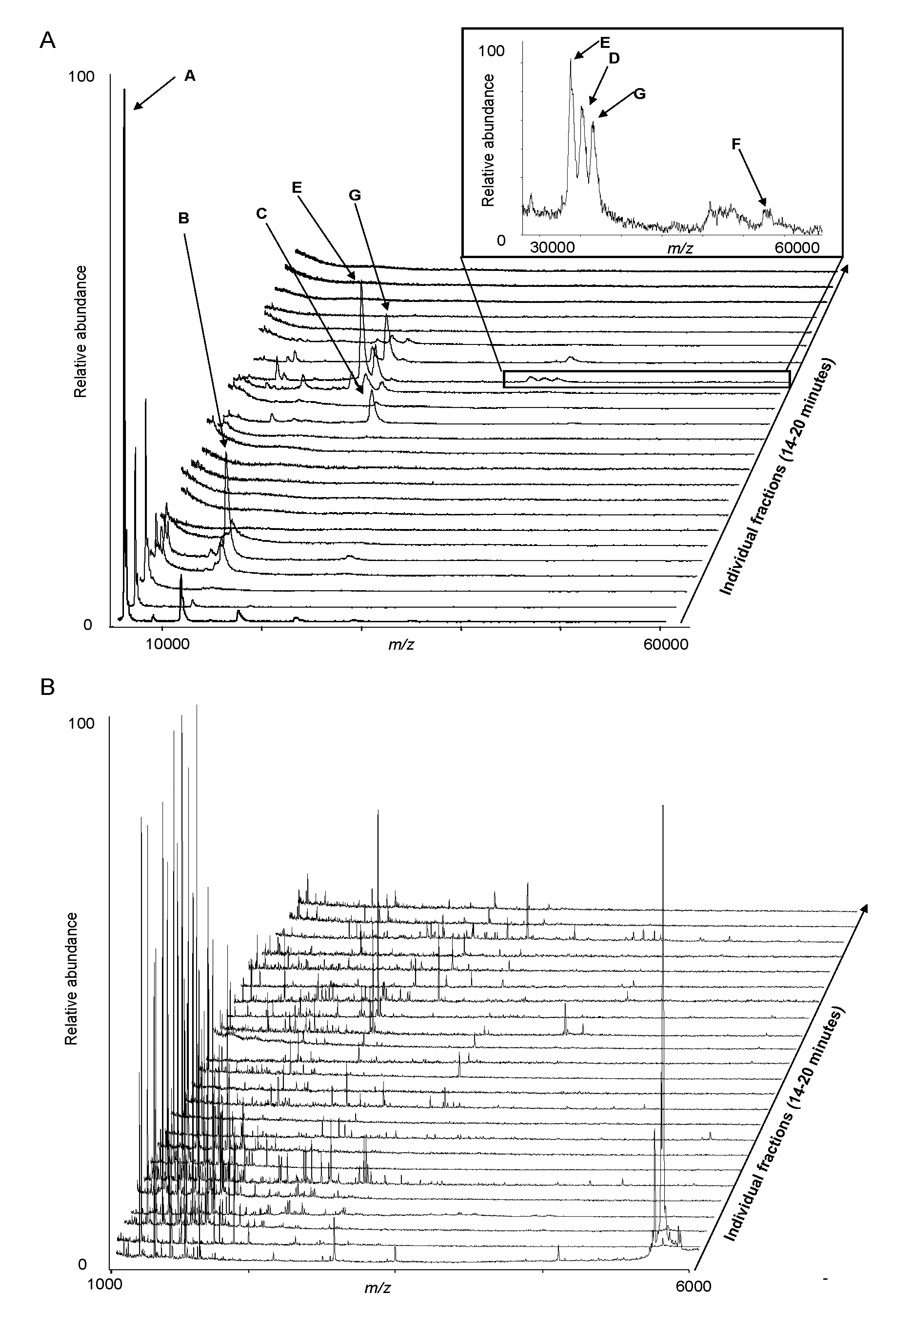
Figure 3. MALDI-TOF MS analyses of the 9 protein mixture after np-RP HPLC separation.
The protein mixture (1 µg of each protein) was separated by np-RP HPLC. 24 fractions were collected from 14 to 20 min into a 96-well plate and subjected either to intact MALDI-TOF MS (A) or to peptide mass mapping after tryptic digestion (B). Each MALDI-TOF spectrum corresponds to an individual fraction. Table 2 provides intact molecular weight information and PMF database search results and sequence coverage for each protein.

