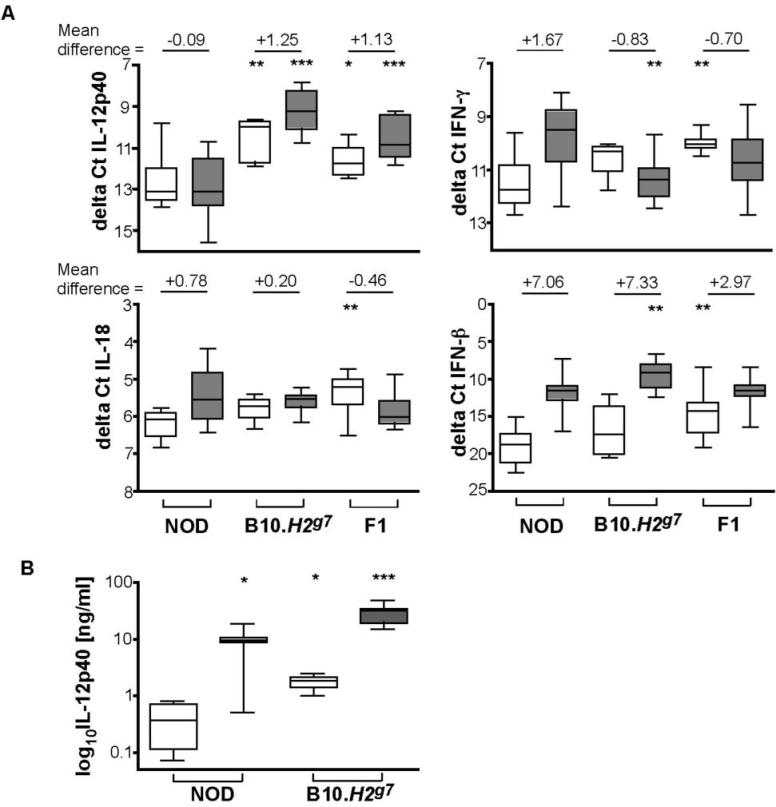
Figure 6. Cytokine expression following poly I:C treatment.
(A) Expression of IL-12, IL-18, IFN-γ, and IFN-β mRNA at 2h in splenocytes of untreated and in vivo poly I:C activated splenocytes. The two resulting cycle numbers (Ct values) at which RNA expression was detected were averaged and normalised to (β2-microglobulin to obtain ΔCt values. Differences within basal and activated groups were calculated using nonparametric (Mann-Whitney) tests and are noted at the top of each. Data from unstimulated B10.H2g7 and F1 mice are compared to unstimulated NOD mice; data from stimulated B10.H2g7 and F1 mice are compared to stimulated NOD mice. *, P < 0.05. **, P < 0.01. ***, P < 0.001. F1 refers to (NOD × B10.H2g7)F1. The numbers of mice per cytokine and condition are: IL-12 (NODunstim = 17, NODstim = 30; B10.H2g7unstim, = 7, B10.H2g7stim, = 9; F1unstim = 6, F1stim = 8), IL-18 (NODunstim = 11, NODstim = 31; BIO.H2g7unstim, = 4, B10.H2g7stim, = 8; F1unstim = 9, F1stim = 12), IFN-γ (NODunstim = 10, NODstim = 31; B10.H2g7unstim, = 5, B10.H2g7stim, = 9; F1unstim = 10, F1stim = 13), IFN-β (NODunstim = 10, NODstim = 32; B10.H2g7unstim, = 4, B10.H2g7stim, = 9; F1unstim = 11, F1stim = 13). (B) Expression of IL-12p40 in sera of untreated and in vivo poly I:C activated NOD and B10.H2g7 mice. IL-12p40 was measured using an antibody-based detection assay. P values were obtained using the Mann-Whitney non-parametric test. Data from unstimulated B10.H2g7 mice are compared to unstimulated NOD mice; data from stimulated B10.H2g7 mice are compared to stimulated NOD mice and data from stimulated NOD mice are compared to unstimulated NOD mice. *, P < 0.05. **, P < 0.01. ***, P < 0.001.

