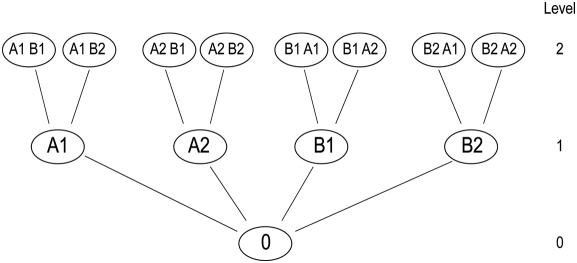
Figure 2. Tree representation of the data.
Letters indicate drugs and numbers indicate different doses of each drug. The root (level 0) is the control (no drugs), level 1 is composed of individual drug measurements (singles), level 2 is composed of combinations of two drugs (couples) and so on. The level corresponds to the size of the combination. Both this tree and the tree of Jelinek [14] contain repetitions.

