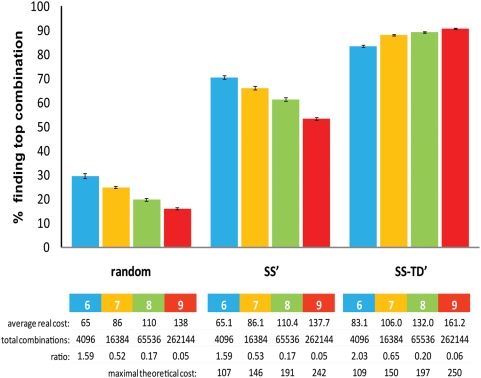
Figure 8. Simulations using 6 to 9 drugs.
The 3 approaches described (randomly chosen group of combinations, SS′ algorithm and the SS-TD′ algorithm) are compared. We report the % of tests (average±SEM from 75 simulations) that can find the best combination, for interventions using 6 to 9 drugs. The cost is expressed as the number of tests. The decline in success rate with an increasing number of drugs for the random and SS′ groups is probably explained by the decreasing proportion of the total possible combinations tested (shown as decreasing ratio). This is not the case for SS-TD′, but we do not yet know if this is a general property of the algorithm. The total number of possible combinations increases exponentially with the number of drugs and becomes quickly too large for our biological measurements (for example with 9 drugs the total is 262144, see rightmost column) and therefore justifies the necessity of an algorithm to limit the experimental space. The maximal cost for the two algorithms (bottom line) is still within the reach of many experiments. This simulation was done using 3 doses per drug.

