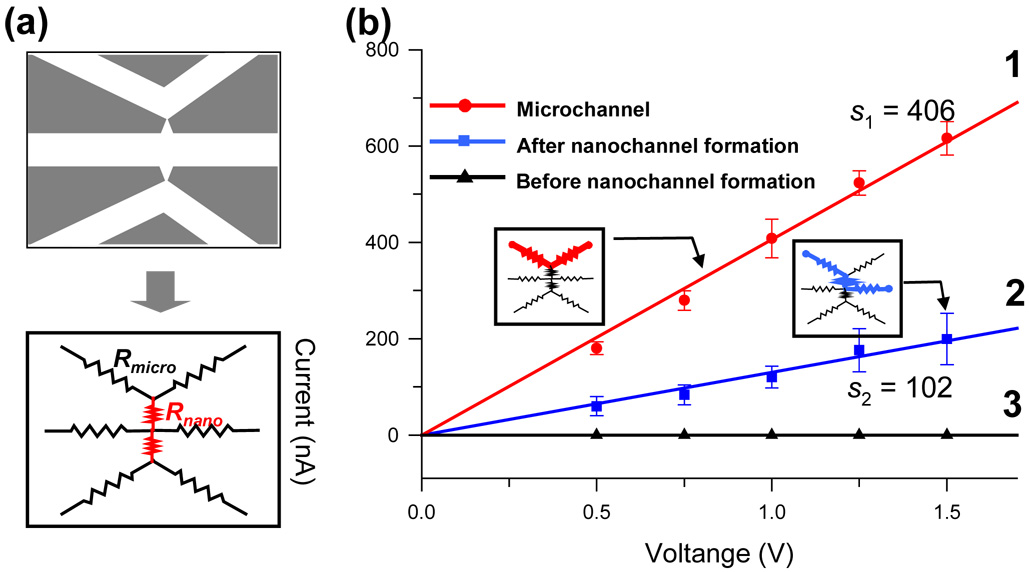
Figure 2.
I-V curves for the estimation of nanogap depth. (a) Simple equivalent circuit for the depth estimation. (b) The I-V curve before and after nanogap formation. Line 1 indicates I-V curve of microchannel (Rm(left channel)+Rm(right channel)) for the reference in the calculation of nanogap depth. Line 2 indicates the I-V curves measured after nanogap formation, while line 3 reveals before nanogap formation. Form simple I-V slope, we calculated nanogap size via simple equivalent circuit model of serial resistance. Experimental nanogap depth in here is approximately 80 nm.

