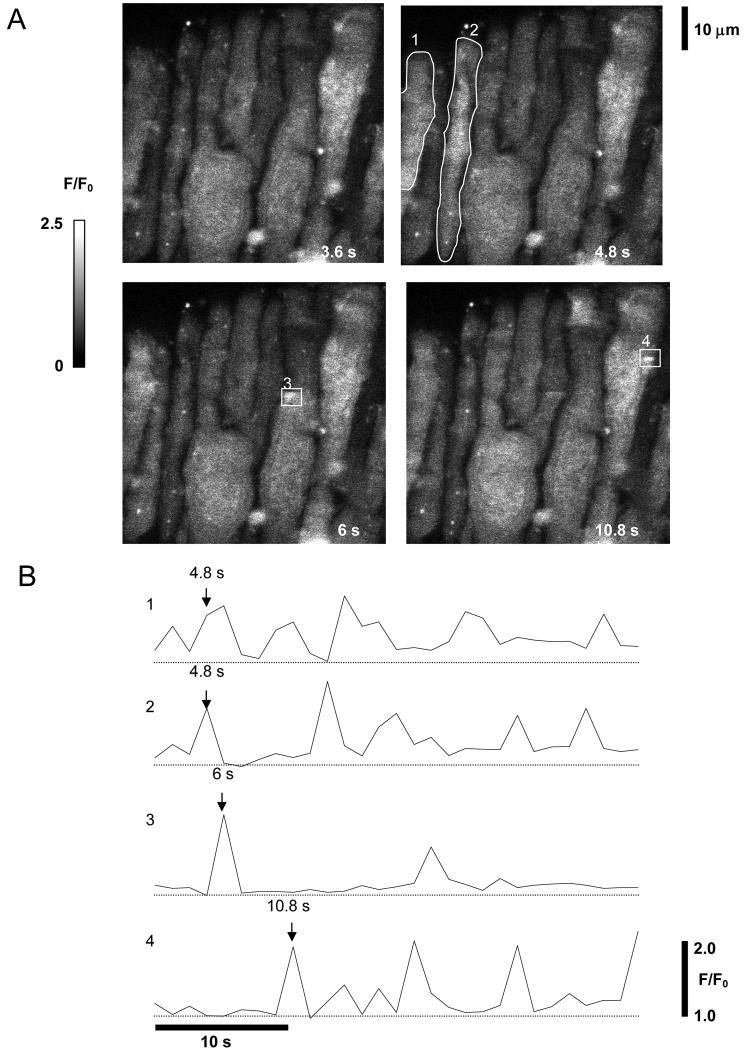
Fig 2.
Ca2+ sparks and waves imaged in fluo-4 loaded retinal MVSM cells. A. Four time frames from a series of XY images of a retinal arteriole. The smooth muscle cells are oriented at right angles to the long axis of the vessel. Fluorescence relative to basal values (F/F0) is represented using a greyscale, as indicated on the calibration bar on the left. Four regions of interest (ROI) are marked and the average fluorescence within each of these regions through the course of the 40s experiment is plotted against time in B. The timepoint at which each frame was captured is indicated by labelled arrows. Both small localised events (ROIs 3 & 4), and generalised Ca2+ oscillations (ROIs 1 & 2), were seen. (A movie showing the spontaneous Ca2+ rises in this vessel is included as supplementary material online : Movie 1.

