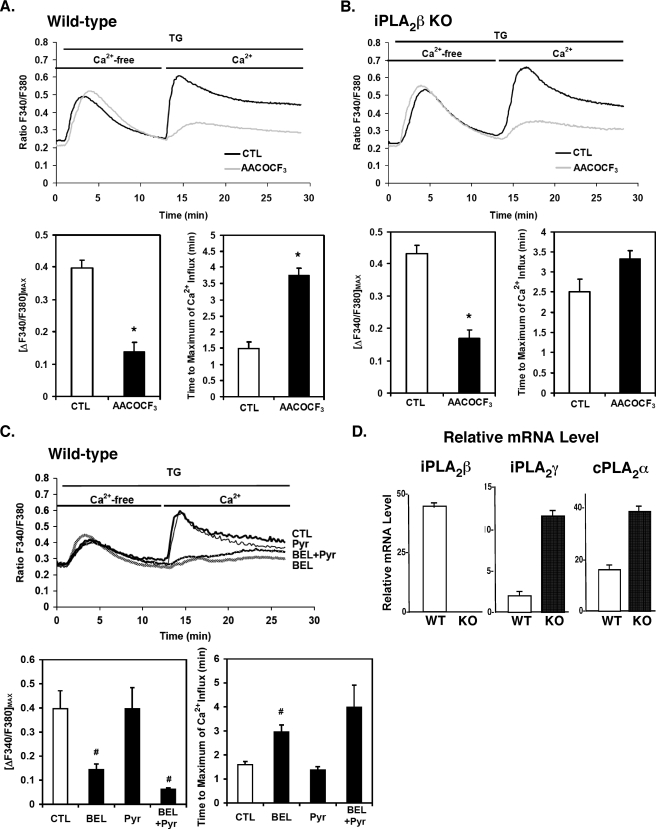
FIGURE 5.
Effects of the PLA2 inhibitors AACOCF3, bromoenol lactone (BEL), and pyrrolidine (Pyr) on TG-induced changes in intracellular [Ca2+] and quantitative PCR of PLA2 message levels in wild-type and iPLA2β-null mouse aortic smooth muscle. First passage aortic SMCs from wild-type (WT) and iPLA2β-null (KO) mice were incubated with Fura-2/AM and then pretreated with either AACOCF3 (25 μm), or ethanol vehicle alone for 1 h at 37 °C. The ratio of fluorescence (F340/F380) in TG-treated cells was monitored as described under “Experimental Procedures.” The maximal amplitudes of Ca2+ entry and the mean time required to achieve maximal amplitude after re-addition of Ca2+ to the medium of TG-treated cells are displayed in the lower two (A and B). Aortic SMCs from wild-type mice were incubated with Fura-2/AM and then were pretreated with either racemic BEL (10 μm), Pyr (0.5 μm), or vehicle alone for 10 min at 37 °C. The F340/F380 ratio was then monitored as described in A and B. The maximal amplitudes of Ca2+ entry and the mean time required to achieve maximal amplitude after re-addition of Ca2+ are displayed in lower two panels (C). Results are independent determinations obtained from three separate animals in each group and are reported as the means ± S.E. *, p < 0.01; #, p < 0.05. Total RNA from wild-type (WT) and iPLA2β-null (KO) first passage aortic SMCs was extracted, and cDNA was prepared with reverse transcriptase. Relative levels of the indicated PLA2 mRNA were quantified by real-time quantitative PCR using specific primers for iPLA2β, iPLA2γ, and cPLA2α as described under “Experimental Procedures.” Each PCR amplification was performed in triplicate, utilizing the following cycling conditions: 2 min at 50 °C and 10 min at 95 °C, followed by a total of 40 two-temperature cycles (15 s at 95 °C and 1 min at 60 °C). Standard curves were generated with serial dilutions of each cDNA sample, and relative mRNA levels were compared at various time points utilizing concurrently amplified ribosomal RNA as an internal standard. Representative results from three independent isolations are presented with standard error bars generated from triplicate determinations (D).

