FIGURE 2.
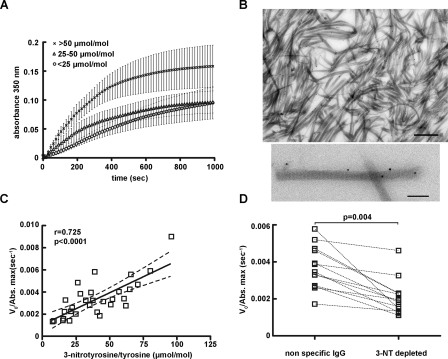
Fibrinogen nitration accelerates fibrin clot formation. A, polymerization curves represent the mean ± S.E., n = 10 subjects per group. B, representative immuno-EM image of fibrin fibers labeled with anti-nitrotyrosine antibodies and 10 nm protein gold; bar, 500 nm (top). Higher magnification of single fibers (bottom) showing the distinctive fibrin band pattern and labeling with anti-nitrotyrosine antibodies; bar, 200 nm. C, the initial velocity V0 of each separate curve, normalized for the final turbidity (V0/Abs. max) was plotted against the 3-nitrotyrosine/tyrosine ratio. Spearman analysis reveals a positive correlation between V0/Abs max and 3-nitrotyrosine/tyrosine ratio (r = 0.73, p < 0.0001, n = 30). D, polymerization assays after immunodepletion. Paired t test statistical analysis showed a marked reduction of the V0/Abs. max after immunodepletion with the anti-nitrotyrosine (NT) immunoglobulin (p = 0.0004, n = 14).

