FIGURE 3.
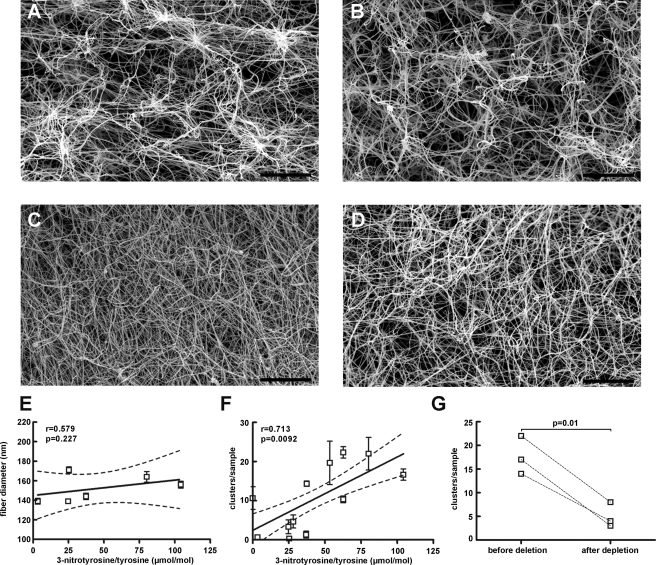
Scanning electron microscopy of fibrin clots. A–C, fibrinogen isolated from three different subjects with 3-nitrotyrosine/tyrosine ratios of 80.2, 37.0, 3.3 μmol/mol, respectively, was used to generate the fibrin clots. D, image from the same sample as in A after immunoaffinity depletion of nitrated molecules. Based on the efficiency of immunoaffinity depletion (65 ± 11%, n = 4) the level of 3-nitrotyrosine/tyrosine is ∼28 μmol/mol in this sample. E, fiber diameter is independent of levels of fibrinogen nitration. F, correlation between fibrin clot cluster formation and fibrinogen nitration levels. Spearman's r = 0.71, p = 0.0092, n = 12. G, removal of tyrosine-nitrated molecules by immunoaffinity depletion results in fibrin clots with a significantly decreased number of clusters (p = 0.01, n = 3). Bar = 20 μm.

