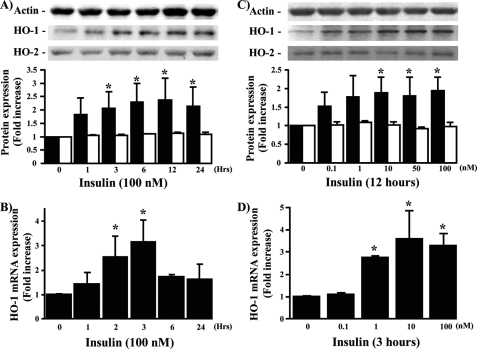
FIGURE 2.
Time- and dose-dependent effect of insulin on HO-1 mRNA and protein expression. BRPC were treated with insulin in a time- (A and B) and dose-dependent manner (C and D). HO-1 (black bars) and HO-2 (white bars) protein (A and C) and mRNA (B and D) expressions were measured by Western blot and RT-PCR analyses and normalized either by actin or 18 S expression. The experiments were done in triplicate, and one experiment representative of three immunoblots is shown with densitometric quantitation (means ± S.D.) from three separate experiments. *, p < 0.05 versus PBS-treated cells.

