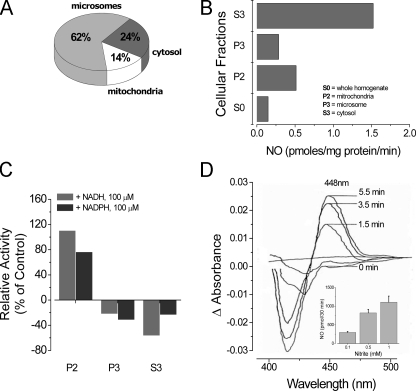
FIGURE 5.
Relative subcellular distribution and activity of hypoxic
 reduction to NO within liver
tissue. A, subcellular fractionation of hepatic tissue reveals
that
  -dependent NO formation is
nonuniformly distributed among cell compartments. B, specific
activity of
  reduction to NO within
subcellular fractions reveals that both cytosolic (S3) and mitochondrial (P2)
compartments exhibit the highest specific
 reductase activities. C,
pyridine nucleotide (NAD(P)H, 100 μm) enhances hypoxia-induced
 reduction to NO (70–110%
increase from control) within the mitochondrial fraction (n = 2).
D, upon supplying
  to
microsomal fractions (containing cyt P450), rapid formation of an
iron-nitrite complex precedes formation of an ironnitrosyl
(λmax = 448 nm) prior to release of NO. Inset,
microsomal NO generation from
  is
concentration-dependent. Increasing
  (0.1–1.0 mm) in hepatic microsomes potentiates NO formation
(n = 3).

