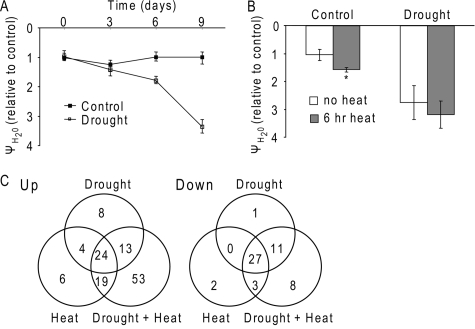
FIGURE 1.
Proteomic analysis of Arabidopsis plants subjected to drought, heat stress, or a combination of drought and heat stress. A, leaf water potential in wild-type (Col-0) Arabidopsis plants subjected to drought stress. B, leaf water potential, relative to control, for well watered, or drought-stressed plants before and after 6 h at 42 °C. *, indicates statistical significance (p < 0.05). C, Venn diagrams of protein spots that increased (Up) or decreased (Down) in their intensity in response to drought, heat stress, or a combination of drought and heat stress.

