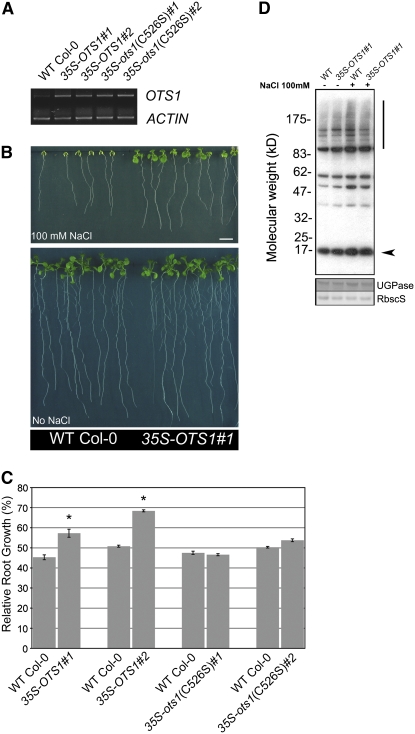
Figure 5.
Overexpression of OTS1 Results in a Salt-Tolerant Phenotype.
(A) RT-PCR transcript analysis (25 cycles) of OTS1 levels in four independent transgenic lines expressing 35S-OTS1 (lines 1 and 2) and 35S-ots1(C526S) (lines 1 and 2) compared with wild-type Col-0. ACTIN was used as a loading control. The OTS1 expression levels in transgenenic lines were verified in more than three independent experiments with similar results.
(B) Phenotype of a representative transgenic line 35S-OTS1#1 compared with the wild type after 15 d of growth on an agar plate in the presence or absence of 100 mM NaCl (Bar = 1 cm).
(C) Quantification of root growth on 100 mM NaCl–supplemented plates expressed as a percentage relative to the untreated condition in four independent transgenic lines, with each one being compared with the wild type. All transgenic lines were tested in at least four independent experiments with similar results. Error bars indicate se (n = 17 to 22). Asterisks indicate significant differences from the wild type (P < 0.01).
(D) Immunoblot with SUMO1/2 antibodies of total protein (10 μg loaded for each lane) derived from 35S-OTS1#1 and wild-type Col-0 seedlings grown for 15 d in the absence (−) or presence (+) of 100 mM NaCl. The experiment was repeated three times with similar results. The arrowhead and vertical bar indicate free SUMO1/2 and conjugated SUMO1/2, respectively. In the bottom panels, UGPase immunostaining and Ponceau staining of Rubisco small subunit (RbscS) were used as loading controls.

