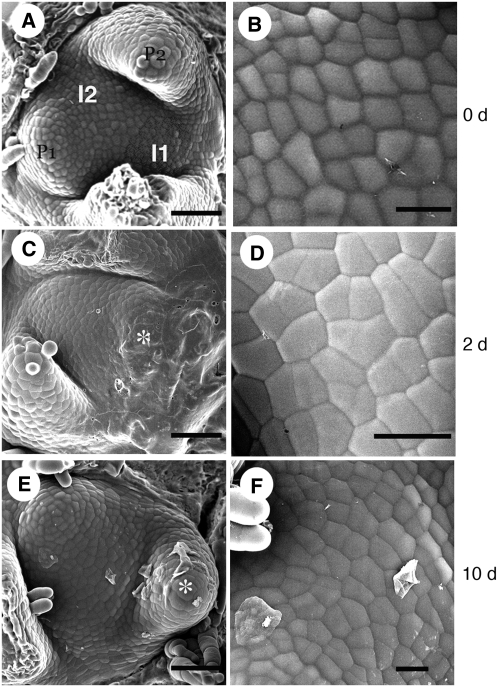
Figure 6.
Scanning Electron Microscopy Analysis of the Apex after Local Repression of ABP1.
(A) SAM prior to microinduction indicating the I1 and I2 positions on the surface. I1 is highlighted in gray.
(B) Epidermal cell pattern at the I1 position prior to microinduction.
(C) A NtSS12S6 SAM 2 d after microinduction at the I1 position. A leaf primordium (partially obscured by remnants of the AhTet containing lanolin used in the microinduction) has formed (asterisk) at the position equivalent to I1 in (A).
(D) Epidermal cell pattern of I1-derived tissue 1d after microinduction of a NtSS12S6 SAM.
(E) NtSS12S6 SAM 10 d after microinduction at the I1 position. A leaf primordium (asterisk) has formed at the position equivalent to I1 in (A), as has a subsequent primordium (equivalent to the I2 position in [A]).
(F) Epidermal cell pattern on the NtSS12S6 SAM surface just internal to the primordium derived from an I1 region induced to repress ABP1.
Bars = 40 μm in (A), (C), and (D) and 25 μm in (B), (D), and (F).

