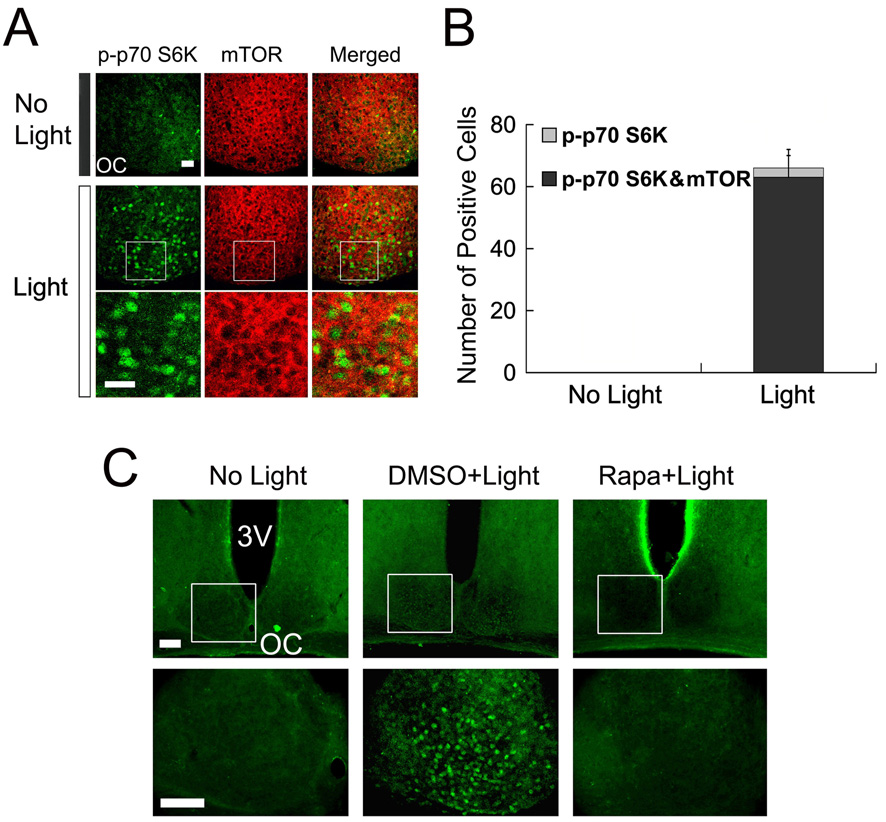
Figure 2. Light-induced p70 S6K activation is mTOR-dependant.
A, Representative confocal images showing colocalization of phosphorylated p70 S6K (p-p70 S6K, green) and mTOR (red) in the SCN. Compared with “no light” control animals (top), a 15-minute light treatment (400 lux) at CT 15 elicited robust p70 S6K activation in the SCN. The merged immunolabeling images (right column) reveal a largely nuclear expression pattern for p-p70 S6K and a cytoplasmic expression pattern for mTOR. OC, optic chiasm. Boxed regions are magnified below each image. Scale bars: 20 µm. B, Quantification of light-induced p-p70 S6K expression and its colocalization with mTOR in the SCN. Cellular coexpression of p-p70 S6K with mTOR was detected in 95% p-p70 S6K positive cells (315 out of 330 cells counted from five mice). Quantitation was performed on 5 control (no light) mice. Error bars denote SEM. C, Representative fluorescent micrographs showing that infusion of the mTOR inhibitor rapamycin blocks light-induced p-p70 S6K expression. Two µl of rapamycin (100 µM) or dimethylsulfoxide (DMSO, vehicle) was infused into the lateral ventricle 30 min before a 15-minute light treatment at CT 15. The boxed regions are shown below. Scale bar, low magnification: 100 µm, high magnification: 75 µm; OC, optic chiasm; 3V, third ventricle. Statistical analysis is presented in figure 5C.

