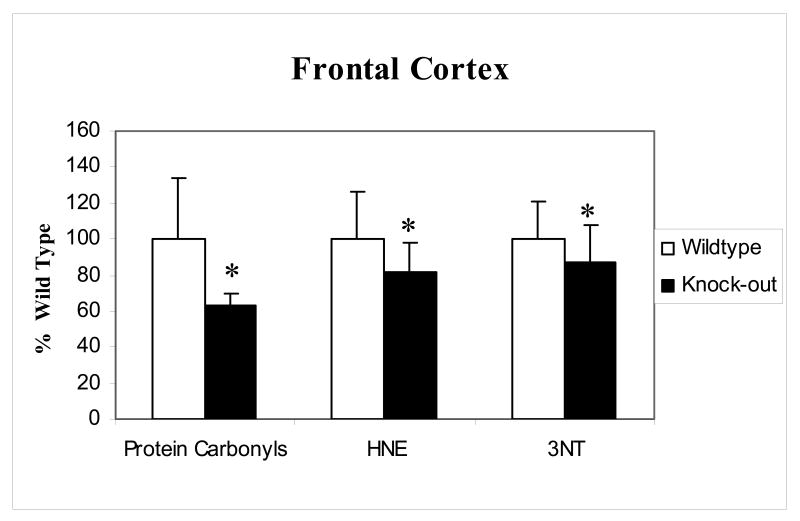
Figure 1.
Protein carbonyl, 3NT and HNE levels in the frontal cortex of p50 (-/-) compared to wild type. There was a significant reduction in the levels of protein carbonyls, 3NT and HNE in the p50 (-/-) mice compared to the wild type. Data are represented as % Wild type (WT); error bars indicate the SEM for each group measured (* p<0.05 n=5).

