
Figure 2.

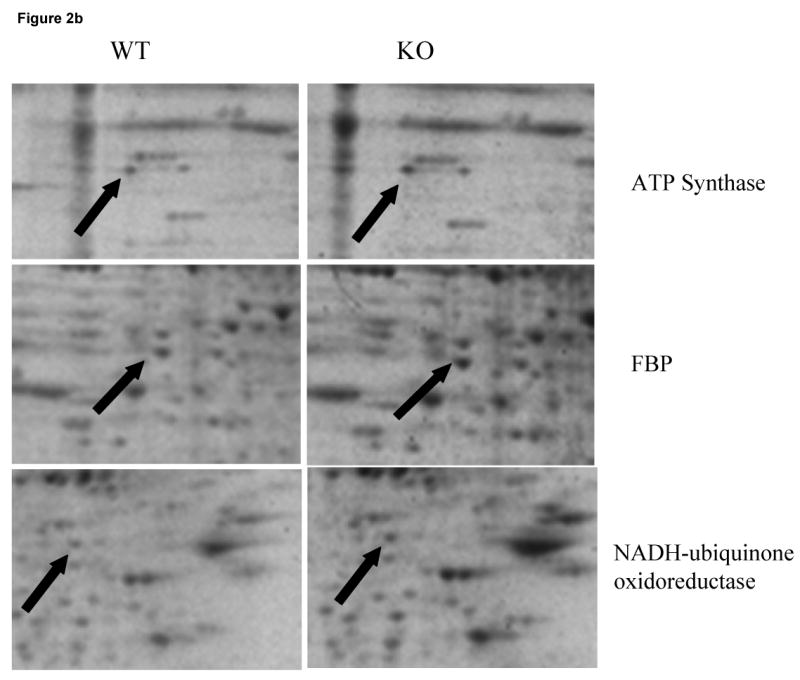
Figure 2a: SYPRO Ruby-stained 2D-gels maps of frontal cortex brain samples from Wild-type vs. p50 (-/-) mice. Proteins identified by mass spectrometry showing differential expression are presented as the boxed spots.
Figure 2b: An expanded view of SYPRO Ruby-stained 2D-gels maps for a select proteins identified whose expression was found to be significantly increasesd. Left panel shows the WT while right panel shows the KO gels. Proteins are marked by the solid arrows.