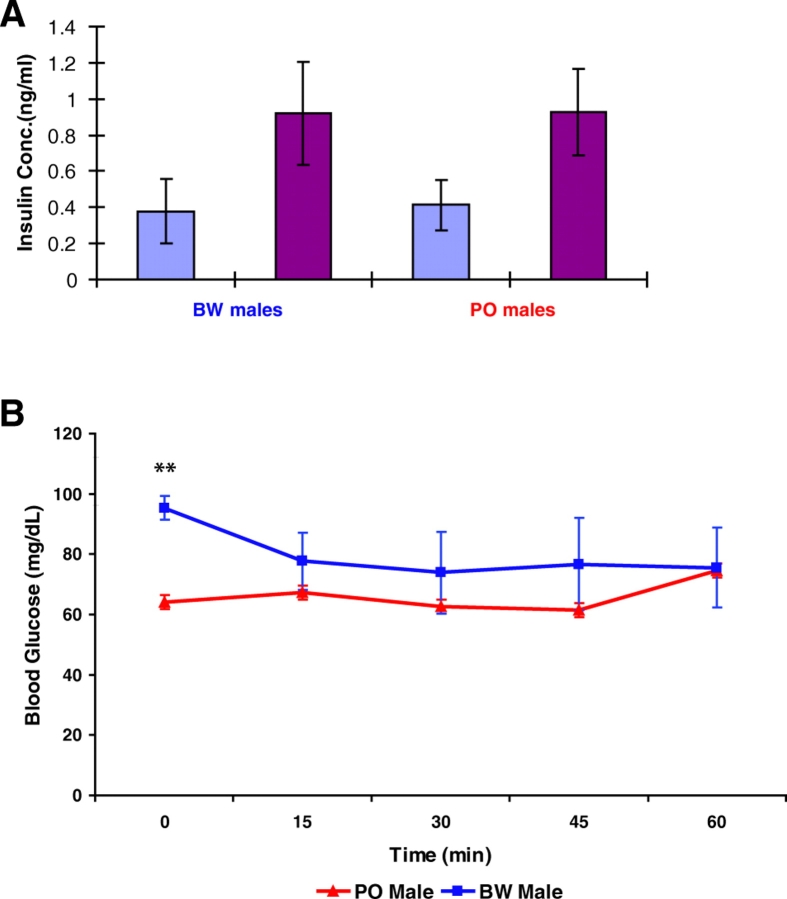
Fig. 3.
Insulin concentrations and tolerance in Peromyscus males. (A) Insulin ELISA data. Light blue columns indicate the insulin concentration at the time of glucose administration; burgundy columns indicate the values at 15 minutes post-administration. Mean values ± s.e. are shown. Genotype indicated beneath columns. (B) Insulin tolerance test (ITT) data for PO and BW males. Significance was determined by using the Student’s t-test; P values are indicated by asterisks: *P=0.05, **P≤0.005, ***P≤0.001.

