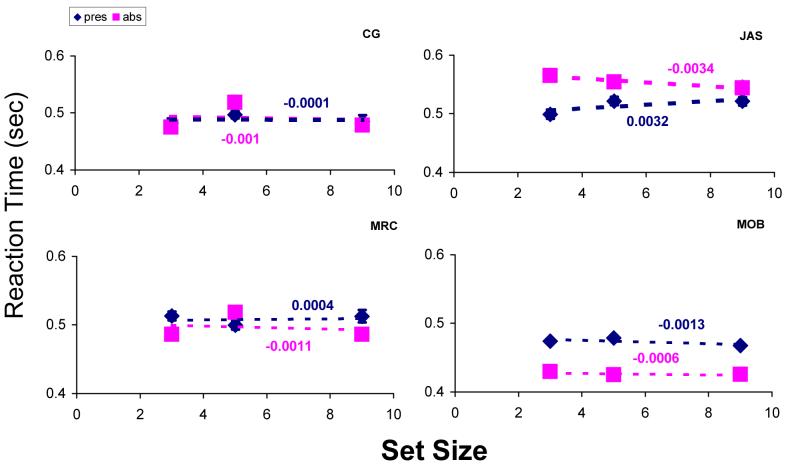
FIG 2.
Reaction times in searches for a unique direction of drift. Blue and pink symbols reflect target-present and target-absent conditions, respectively. Each data point summarises a minimum of 200 trials. Error bars contain the standard error. There was no significant increase in reaction time with set size for none of the four observers. Regression gradients are shown (in seconds per item).

