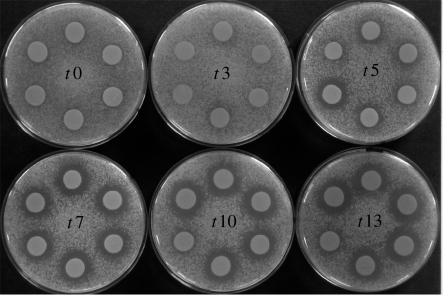
Figure 4.
Evolution of sexual signal strength in populations under high sexual selection treatment. Signal strength (α-pheromone production) is shown by the size of the dark ‘halo’ surrounding each round patch of signalling cells. The halo is caused by the inhibition of growth of an overlaid lawn of MATa tester cells that are hypersensitive to α-pheromone and cannot grow when it is at a high concentration. Thus, a larger halo indicates greater α-pheromone production. Replicates are ordered clockwise from A to F starting at the top of each plate. Results are shown only for the initial population (t0) and experimental cycles 3, 5, 7, 10 and 13.

