Figure 1.
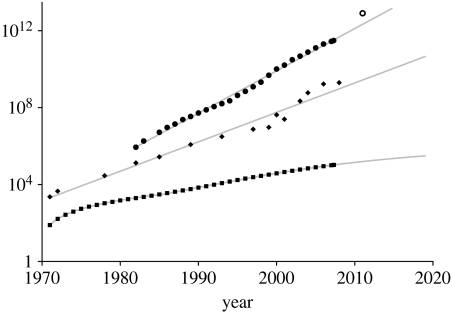
Growth curves relevant to research in molecular phylogenetics and evolution. The graph shows the growth over approximately 40 years of the total number of nucleotides stored in the EMBL Nucleotide Sequence Database (2008; circles), the number of transistors in current Intel PC processors (Intel 2008; Wikipedia 2008b; diamonds) and the cumulative citations found by searching for ‘molecular AND phylogen*’ in the ISI Web of Knowledge (WoK: http://www.isiknowledge.com/; searched on 24 June 2008; squares). Note the logarithmic scale on the y-axis. The sequence database and number of transistors per processor continue to grow exponentially, with doubling times of 16.4 months and 23.6 months, respectively. The open circle indicates the projection based on the additional sequencing effort as an outcome of the recently announced 1000 Genomes project (Spencer 2008). The citations for ‘molecular AND phylogen*’ in WoK are growing at an increasing rate, although slower than exponentially.

