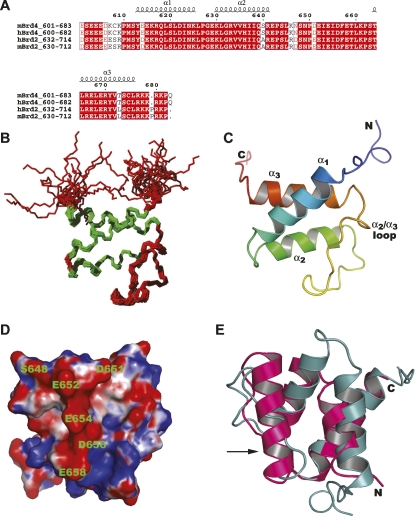
Figure 2.
Solution structure of mouse BRD4-ET. (A) Sequence alignment of BRD4-ET (residues 601–683) with its homologs. The colors are chosen according to the similarity (red box and white character for conserved residues; red character for similarity in a group; blue frame for similarity across groups). (B) Superposition of the backbone atoms of the 20 conformers that represent the solution structure of BRD4-ET for best fit of the backbone atoms N, Cα, C′ of residues 608–676. The α-helical segments are indicated in green. (C) Ribbon diagram of the BRD4-ET domain, viewed as in B, and colored from blue (N terminus) to red (C terminus). (D) Electrostatic surface potential of the BRD4-ET domain showing the acidic region. The surface is colored red and blue for potential values below −5k B T and above +5k B T, respectively, where k B is the Boltzmann constant and T the room temperature. (E) Superposition of the BRD4-ET domain (cyan) with the N-terminal SAP domain of SUMO ligase PIAS1 (pink) (PDB code 1V66). An extra helix (indicated by the arrow) in the SAP domain is replaced by the long α2/α3 loop in the BRD4-ET domain structure.

