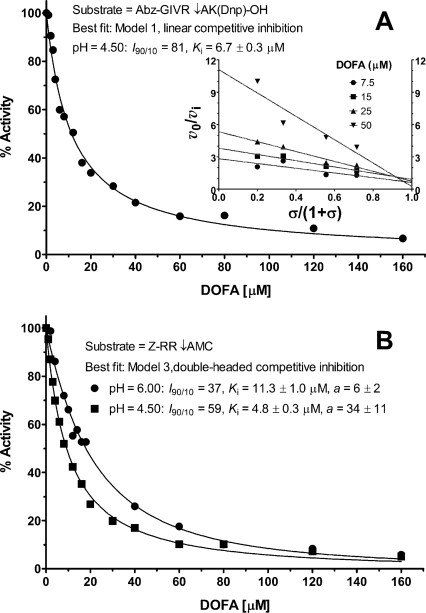
Figure 4.
Inhibition profiles of human cathepsin B by DOFA. Main conditions and best-fit kinetic parameters are shown. (A) Inhibition profile using the FRET substrate Abz-GIVR↓AK(Dnp)-OH (pH 4.5), [S] = K m = 9.7 μM; data were obtained fluorimetrically with λex/λem at 320/420 nm. The inset shows the specific velocity plot at four substrate and four inhibitor concentrations. (B) Inhibition profiles with Z-RR↓AMC as substrate; [S] = K m = 0.47 mM at pH 6.0 (black circles) and [S] = K m = 1.54 mM at pH 4.5 (black squares). Data at pH 6.0 were collected photometrically at 360 nm and those at pH 4.5 were obtained fluorimetrically with λex/λem at 383/455 nm. Fluorescence readings in A and B were corrected for the inner filter effect.

