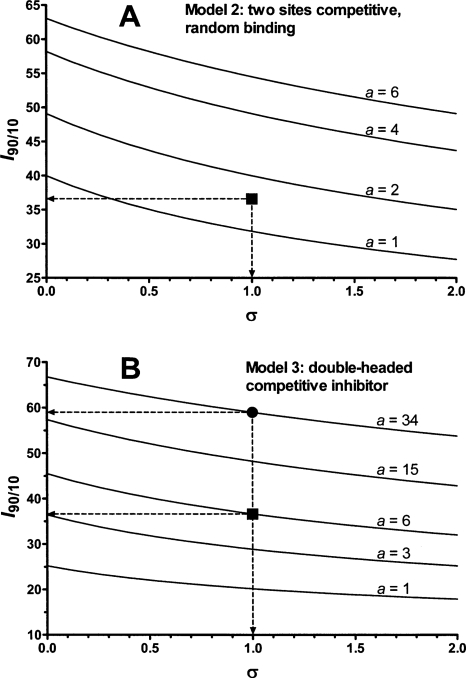
Figure 5.
Ratios of inhibitor concentrations that give 90% and 10% inhibition. For Models 2 and 3 in Figure 3 the I 90/10 ratio depends on a and σ = [S]/K m. Curves were generated with Equations 4 and 6 shown in Figure 3. (A) Curves for Model 2; (B) curves for Model 3. The black squares in panels A and B correspond to the best-fit value of the coefficient a, which coincides with the value obtained by inspection of the inhibition profiles at pH 6.0 in Figure 4B. The black circle in panel B shows the best-fit value of the coefficient a (34), close to the value obtained by inspection of the inhibition profiles at pH 4.5 in Figure 4B.

