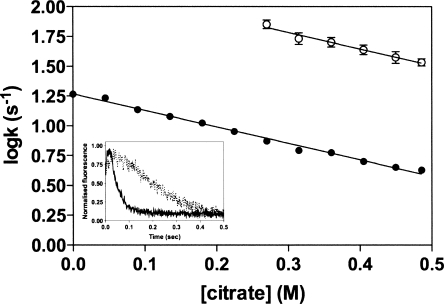
Figure 1.
Effect of citrate concentration on rate of AAT unfolding. Plots of the logarithm of the initial rate of fluorescence increase (○) and the slower rate of fluorescence decrease (•) versus citrate concentration. The inset shows the unfolding of AAT (1 μM), monitored by rapid dilution into 5.5 M GdnHCl, in the presence (solid line) and absence (dashed line) of 0.5 M citrate. Unfolding was followed by monitoring the changes in intrinsic tryptophan fluorescence (excitation wavelength at 280 nm; emission wavelength at 330 nm).

