
Fig. 1.
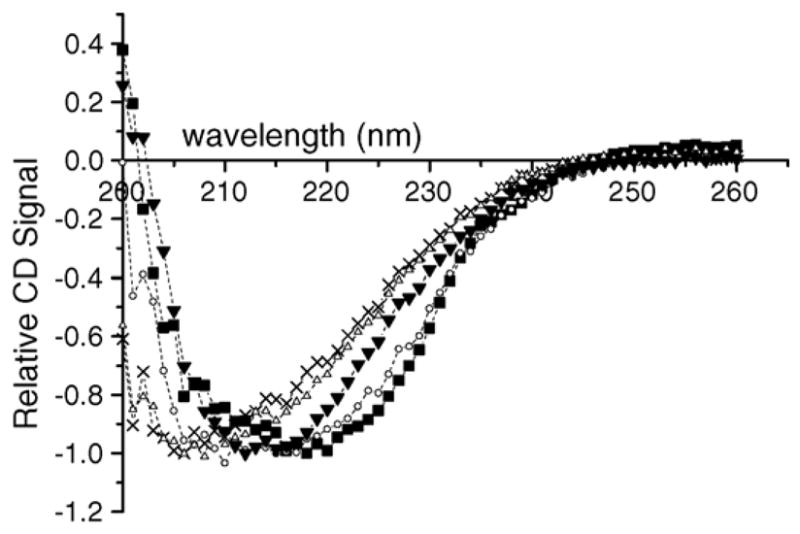
CD spectra of native and denatured Jun a 1 samples. R/A = reduced and alkylated, Gu = guanidine denatured, Gu–R/A = reduced and alkylated after guanidine denaturation, Heat = Jun a 1 heated at 75 °C for 1 h. Symbols are as follows: (■) = native, (●) = R/A, (△) = Gu, (X) = Gu–R/A, (▼) = Heat.