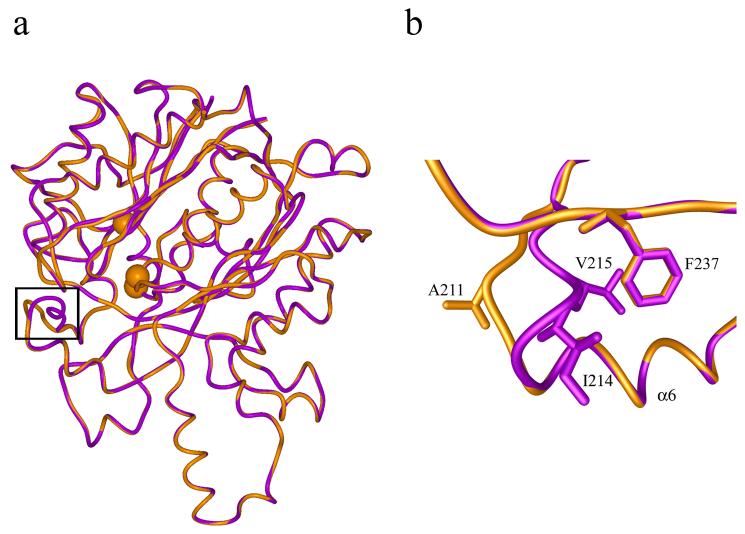
Figure 5.
a) Superposition of mtKasA model (gold) and crystal structure of mtKasB (magenta). The structures are shown in worm representation. The Cα atoms of the active site residues Cys170, His311 and His341 are shown as spheres. The black frame encloses the region of a loop at the entrance to the active site tunnel where the structures are different. b) A magnified view of the region shown in the black frame in a) representing the difference in the structure of the loop between mtKasA and mtKasB. The residues of this loop that are different between the two structures are labeled. This loop region follows the helix α6.

