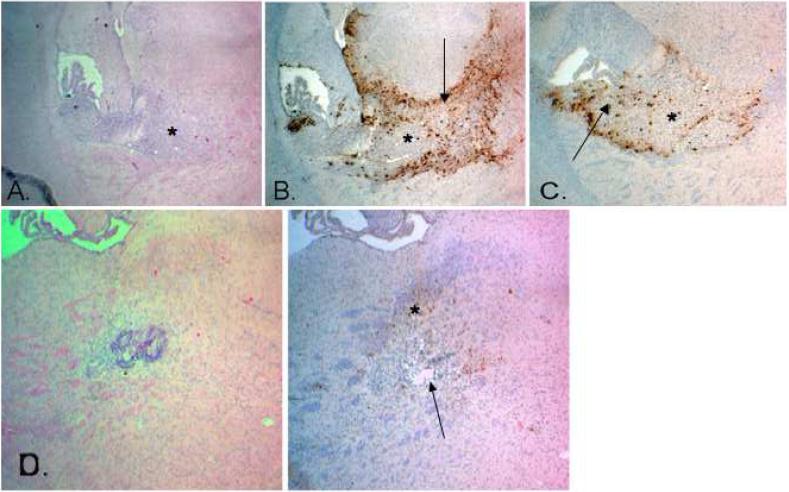
Figure 4.
Photomicrographs of athymic nude mice brain sections containing human U87-MG xenografts after stereotactic intracerebral CED of d106. Magnification, 40X. a, Hematoxylin/eosin-stained section day 7 after tumor implantation and 2 days after d106 CED revealing boundaries of xenograft (shown by *). b, Corresponding GFP-stained section revealing marked xenograft (*) infection and viral spatial distribution into the surrounding brain (shown by arrow). c, GFP-stained section day 7 showing strong xenograft (*) infection and extensive viral spatial distribution within the tumor (shown by arrow). d, Hematoxylin/eosin-stained section day 17 after tumor implantation (left) and corresponding GFP-stained section (right) revealing complete tumor regression (shown by arrow) and continued GFP expression at the xenograft site suggestive of persistent viral infection (shown by *).

