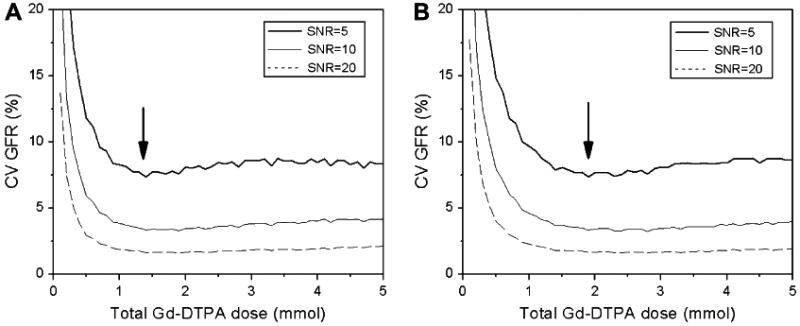
Figure 4.

The effect of gadolinium dose on precision of GFR measurement with MRR. Coefficient of variation (CV) of GFR was estimated by Monte Carlo simulations for normal (a) and diseased (b) kidney versus the total injected dose. Arrows indicate the minimum of CV.
