
Figure 7.
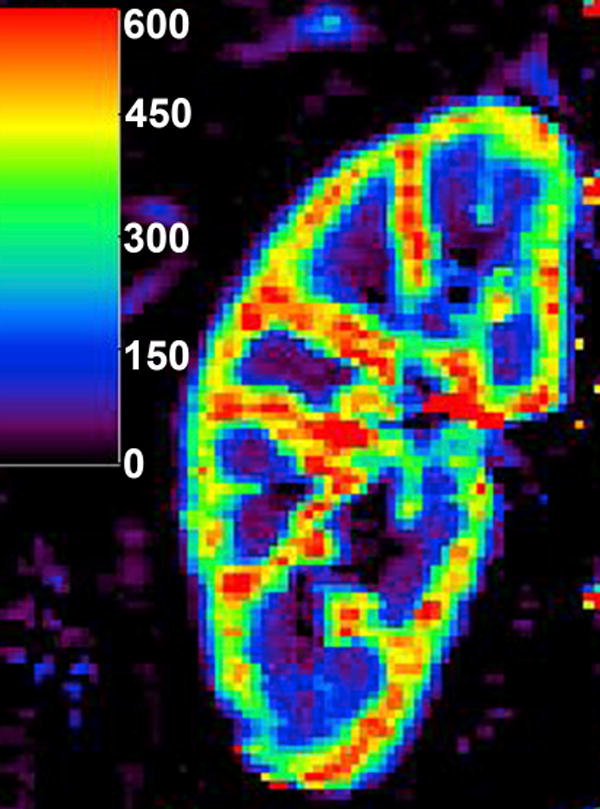
Perfusion map calculated with two-compartment model of Annet et al (20) in a normally functioning kidney. The units of the color bar are mL/min/100mL. The regions of extremely high flow (red) are likely to reflect the renal vessels.
Official websites use .gov
A
.gov website belongs to an official
government organization in the United States.
Secure .gov websites use HTTPS
A lock (
) or https:// means you've safely
connected to the .gov website. Share sensitive
information only on official, secure websites.
Perfusion map calculated with two-compartment model of Annet et al (20) in a normally functioning kidney. The units of the color bar are mL/min/100mL. The regions of extremely high flow (red) are likely to reflect the renal vessels.