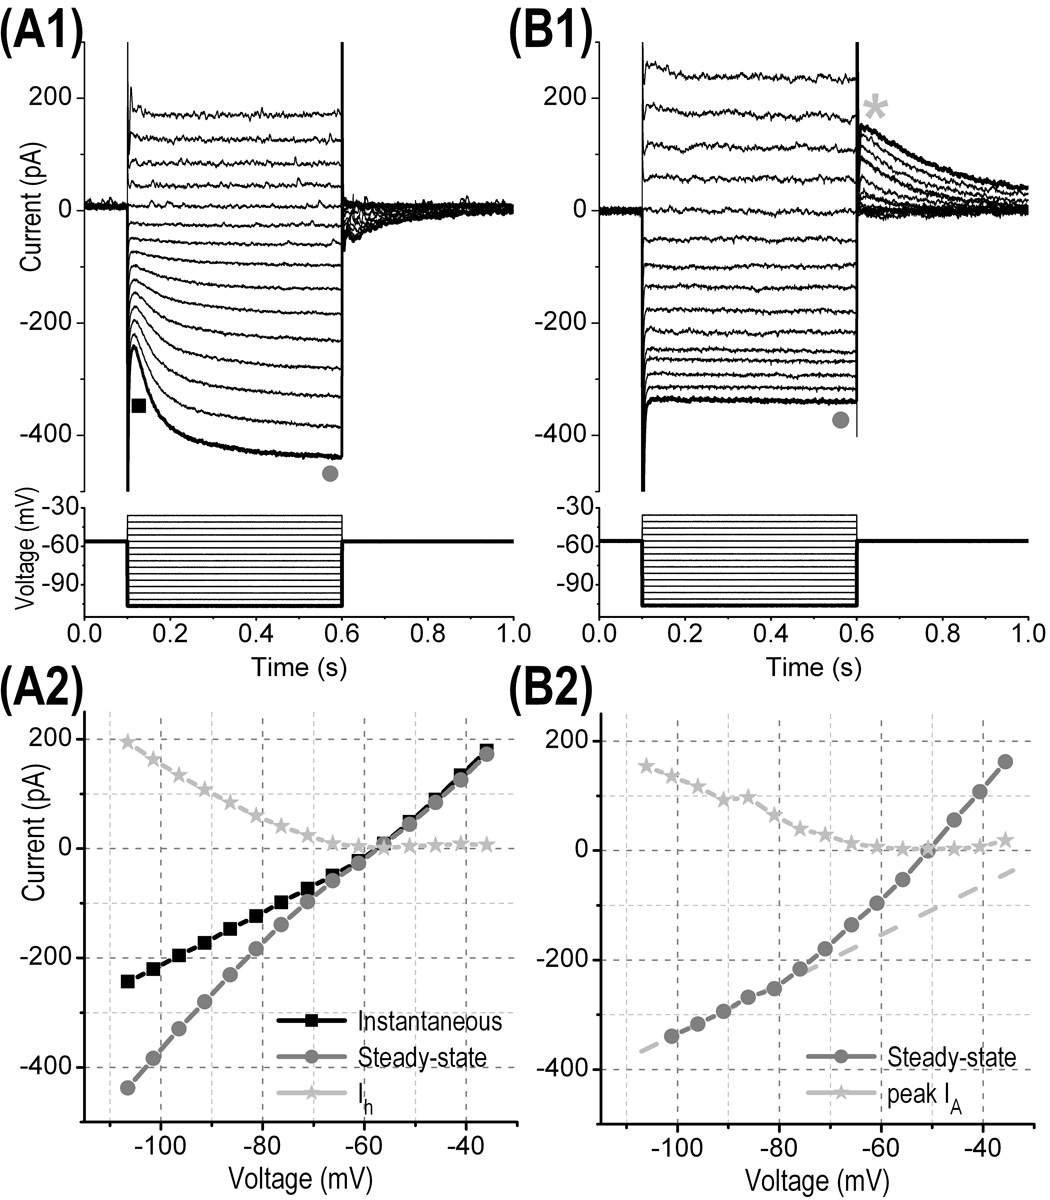
Figure 3. Typical membrane currents of DRG neurons recorded in whole-cell voltage clamp mode in the intact ganglion.
(A1) and (A2) Current responses of 2 different DRG neurons to membrane voltage steps (bottom of each panel) of 500 ms duration from −50 mV below baseline holding potential to +30 mV above baseline holding potential (5 mV increment between consecutive sweeps). (B1) Current-voltage traces of the instantaneous current (squares) and the steady-state current (circles) measured respectively at the position of the square and the circle shown in (A1). The time-dependent inward current (Ih) trace (calculated by subtracting the 2 previous traces) indicates that Ih was produced with hyperpolarizing voltage steps <−65 mV. (B2) The current-voltage trace of the steady-state current measured at the position of the circle shown in B1 exhibits an outward rectification at membrane potential >−70 mV (as compared to the extrapolated dashed straight line) suggesting the activation of a potassium delayed rectifier. The peak amplitude of a potassium IA current (asterisk shown in (A1)) that developed after the cessation of hyperpolarizing voltage steps was also plotted as a function of the hyperpolarizing voltage step. Note that IA developed after hyperpolarizing voltage steps <−65 mV.

