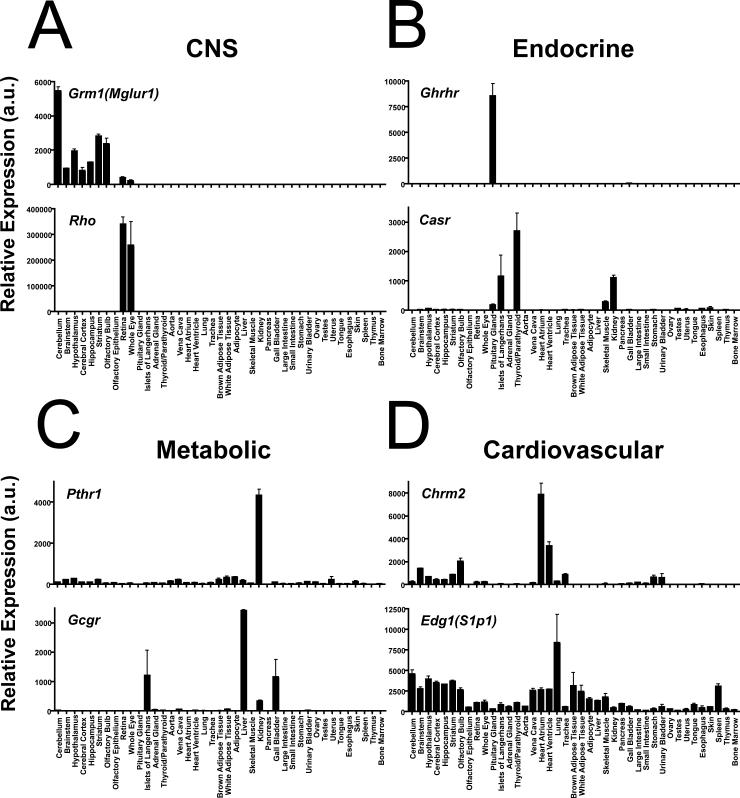
Fig. 2. qRT-PCR tissue distribution yields predicted patterns of expression.
Representative GPCRs that were highly expressed in distinct tissue systems were selected from Fig. 1B and Table 1 to illustrate tissue specificity, range of expression levels, and reproducibility. Examples are shown for A) CNS: metabotropic glutamate receptor 1 [Grm1(Mglur1)] and rhodopsin [Rho]. B) Endocrine system: growth hormone releasing hormone receptor [Ghrhr] and the extracellular calcium-sensing receptor [Casr]. C) Metabolic tissues: parathyroid hormone receptor 1 [Pthr1] and glucagon receptor [Gcgr]. D) Cardiovascular system: M2 muscarinic receptor [Chrm2] and the sphingosine-1-phosphate receptor 1 [Edg1(S1p1)]. Values are plotted as the mean ± SEM; n=2−5.

