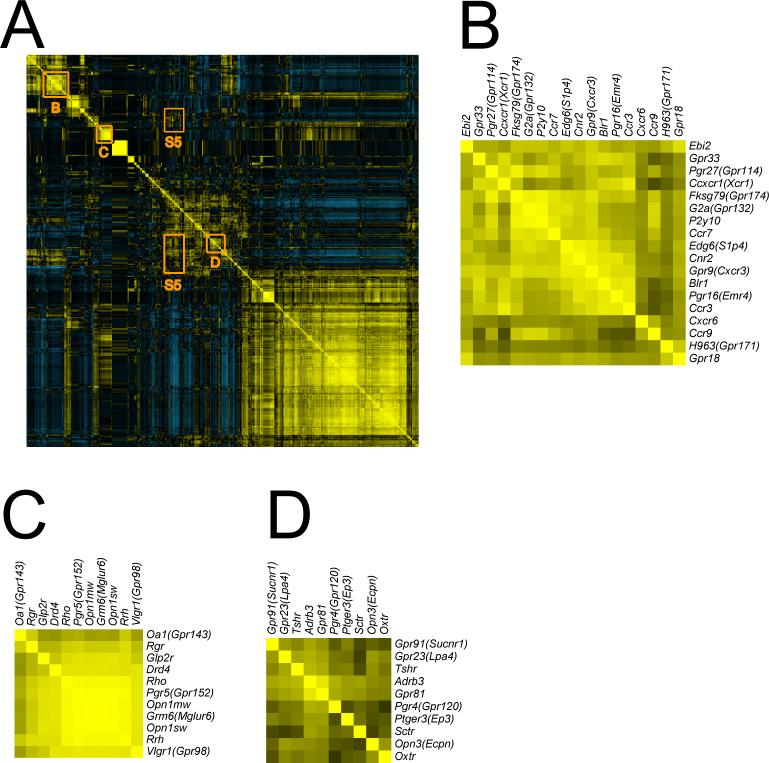
Fig. 5. Hierarchical-Cluster analysis of pairwise GPCR expression reveals additional levels of interaction.
A) Pearson correlation r coefficients were calculated for interactions between each GPCR with all others based on tissue expression patterns. The resulting data set was further analyzed using Cluster 3.0 with complete linkage and visualized using TreeView. A thumbnail image is shown here, a full size image is available in Supplemental S4. Receptors with similar distributions are shown in yellow; distinct distributions are shown in blue; X- and Y-axis are mirror images of one another. The diagonal represents each receptor interacting with itself (perfect similarity in distribution). B) Clustering of receptors by similarity of expression reveals a immune/hematopoietic grouping very similar to that in Fig. 3B; C) an eye/retinal cluster similar to that in Fig. 3E; and D) an adipose cluster similar to that in Fig. 4A. However, analysis of GPCR interaction clusters off the diagonal suggested receptor functions outside of their most obvious physiological roles. This might aid in understanding and predicting on-target drug side effects (see Discussion and supplementary figure S5).

