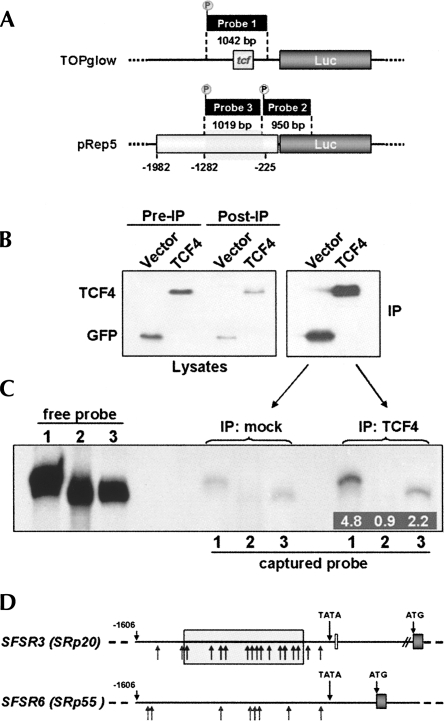
FIGURE 5.
Binding of the SFSR3 gene promoter to TCF4. (A) Drawing showing the three promoter fragments used as radioactive probes in DNA/protein coimmunoprecipitation assays. Probes 1 and 2 served as positive or negative controls, respectively, whereas probe 3 corresponds to the transcriptionally responsive promoter region (gray shaded area between nucleotides −225 and −1282). (B) Anti-GFP-stained Western blot showing the expression of GFP (control) and GFP-Δ31TCF4 in cell lysates (Pre-IP) before and (Post-IP) after immunoprecipitation with monoclonal anti-GFP antibody ab1218, as well as the corresponding precipitated proteins (IP). (C) Autoradiograph of the polyacrylamide gel used to separate the radio-labeled DNA probes. (“free probe” lanes) Document comparable probe labeling efficiency; (“captured probe” lanes) show the amount of probe precipitated by either GFP (control) or GFP-Δ31TCF4. Inserted numbers indicate the band intensity quantification compared to the corresponding control bands. (D) Schematic comparison of the SFSR3 and SFSR6 gene promoters. (Arrows) Potential TCF4 binding sites. (The gray box) The SFSR3 promoter region identified in Figure 4 that was required to respond to β-catenin-TCF4 signaling.

