


Figure 2.
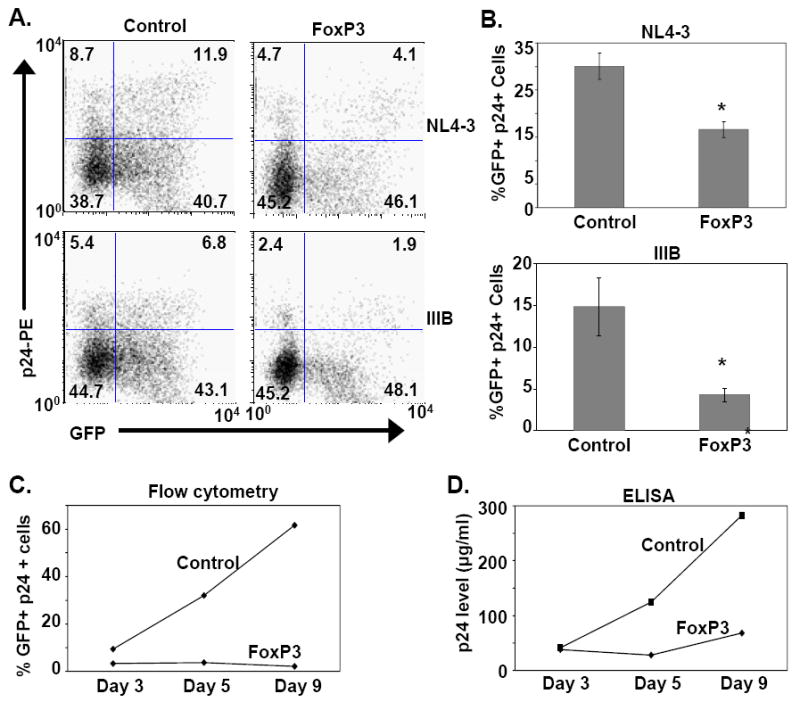
FOXP3 expression inhibits HIV-1 infection in T-cells. (A) Primary human CD4 T-cells were activated with anti-CD3/CD28 antibody conjugated beads and transduced with FOXP3 or control lentivirus as described in the Materials and Methods. Transduced T-cells were infected with HIV-1 NL4-3 or IIIB and monitored for p24-gag expression by flow cytometry. Lentivirus-transduced cells were monitored by their expression of GFP. Dot plot analysis of one representative experiment of 3 is shown. GFP expression (transduced cells) is noted along the x-axis, and p24-gag expression is depicted on the y-axis. The percentages of cells for each quadrant are noted in the corners of the respective quadrants. (B) The percentages of p24+ cells in transduced (control or FOXP3) T-cell cultures are shown in the bar graphs for the NL4-3 and IIIB infected cells, respectively. The mean ± SEM of 3 experiments performed is shown and compared between control and FOXP3-transduced cells (p=0.015 for NL4-3, and p=0.06 for IIIB). (C) The time course of HIV-1 IIIB infection of the control- and FOXP3-transduced CD4 T-cells is shown as % p24+ cells (y-axis) versus days of infection (x-axis). One representative of 3 experiments is shown. (D) p24 levels (y-axis) in the supernatant of the IIIB infected CD4 T-cells was measured by ELISA and is shown over time in days post-infection (x-axis). One representative of 3 experiments is presented.