Abstract
Voxel-based morphometry was used to compare brain structure morphology of survivors of posterior fossa brain tumor (PFBT) with that of normal sibling controls to investigate disease- or cancer treatment–induced changes. Two different spatial normalization approaches that are available in public domain software (free-form deformation (FFD) and discrete cosine transform (DCT)) were compared for accuracy of normalization in the PFBT patients. Anatomical landmark matching demonstrated that spatial normalization was more accurate with FFD than with DCT. Voxel-based morphometry of the FFD-normalized magnetic resonance images from PFBT survivors and sibling controls detected reduced gray matter density in the thalamus and entorhinal cortex and reduced white matter density in the internal capsule, hypothalamus, corpus callosum, and cuneus of the occipital lobe in the PFBT survivors. Identification of these morphologic lesions may help localize the neural substrates of disease- or therapy-induced cognitive deficits in survivors of childhood cancer.
Introduction
Long-term survivors of pediatric brain tumors suffer a variety of cognitive deficits in intelligence, memory, attention, and fine-motor functions (Copeland et al., 1985; Konczak et al., 2005; Mulhern et al., 1988; Mulhern et al., 1999; Mulhern et al., 2004; Palmer et al., 2001; Reeves et al., 2006; Steinlin et al., 2003). Cognitive deficits may be caused by brain tumors located in the central nervous system (CNS) or by treatments directed at the CNS such as chemotherapy and cranial radiation therapy (CRT). Many studies have investigated the association between CNS-directed treatment and structural damage of the brain. Brain structural changes such as atrophy from gray and white matter loss or developmental deficits in the corpus callosum that are known to occur after CNS-directed treatments have been correlated with cognitive deficits (Macedoni-Luksic et al., 2003; Mulhern et al., 1999; Mulhern et al., 2001; Palmer et al., 2002; Reddick et al., 2003; Reddick et al., 2005; Steen et al., 2001), but the specific neural substrates of those deficits are largely unknown. Neuroimaging techniques, including functional MRI (fMRI) and diffusion tensor imaging (DTI), are promising new tools to investigate brain structure and function in such patients (Helton et al., 2005; Phillips et al., 2005; Ries et al., 2004; Zou et al., 2005). Improved characterization of disease- and treatment-induced morphologic changes is needed to facilitate analysis and interpretation of functional neuroimaging results.
Voxel-based morphometry (VBM) facilitates a voxel-wise comparison of the local tissue characteristics throughout the whole brain, between groups of subjects to detect subtle brain structural changes (Ashburner and Friston, 2000; Ashburner and Friston, 2001; Wright et al., 1995). VBM analysis requires spatial normalization, and the accuracy of spatial normalization limits the accuracy and validity of the morphometric comparisons. Two different spatial normalization approaches that have been implemented in public domain software tools were evaluated. The spatial normalization approach in Statistical Parametric Mapping version 2 (SPM2) software package (http://www.fil.ion.ucl.ac.uk/spm/) uses discrete cosine transform (DCT) as the transformation model and the sum of squared differences (SSD) between an image and a template as the similarity measure. This approach can adequately normalize brain images that lack obvious focal brain structural abnormalities; however, normalization in brain tumor survivors frequently is complicated by the presence of enlarged ventricles and surgical resection cavities postoperatively in brain parenchyma. The DCT may be insufficient to model large focal warping to normalize enlarged ventricles from obstructive hydrocephalus associated with the tumors, and the SSD similarity measure could be biased by surgical cavities. Lesion masking improves DCT-derived spatial normalization (Brett et al., 2001); however, we have found this approach to be inadequate for the post-operative patient group.
An alternative approach to spatial normalization implemented in VTK CISG Registration Toolkit (http://www.image-registration.com) uses free-form deformation (FFD) to model the spatial transform and normalized mutual information (NMI) to measure image similarity (Rueckert et al., 1999; Rueckert et al., 2003). FFD is capable of modeling large focal warping, and NMI is less susceptible to the distortion caused by the local anatomical mismatches (Studholme et al., 1997). We compared these two commonly used spatial normalization approaches, then conducted VBM to investigate brain structural abnormalities in pediatric PFBT survivors.
Materials and methods
Subjects
All subjects gave written informed consent to participate, as approved by the Institutional Review Board of St. Jude Children's Research Hospital (St. Jude). Two groups were recruited for brain structural comparison and matched for age, sex, and handedness to avoid any potentially confounding interaction from these factors (Good et al., 2001b; Good et al., 2001a). The patient group consisted of 13 PFBT survivors (7–17 years old, mean age 12.3 ± 3.1 years) treated at St. Jude. This group included 4 boys and 9 girls, with 3 left-handed according to self-report. All of the PFBT survivors had undergone CRT and chemotherapy. The control group consisted of 14 healthy siblings of cancer patients (8–17 years old, mean age 13.3 ± 2.3 years). The control group included 4 boys and 10 girls, with 3 left-handed.
MRI
A 1.5-T Siemens Symphony scanner (Siemens Medical Solutions, Erlangen, Germany) was used to acquire high-resolution, 3-dimensional (3D), T1-weighted images in the sagittal orientation, covering the whole brain in all patients and controls. The pulse sequence used for the MR scans was MPRAGE with the following sequence parameters: TR, 1800 ms; TE, 2.74 ms; 15° flip angle; 128 slices, thickness, 1.25 mm; FOV, 210 × 210 mm; matrix, 512 × 512.
Spatial normalization
Two approaches of spatial normalization (FFD and DCT) were evaluated. Spatial normalization was a two-step process with a linear transform (affine) followed by a nonlinear transform (warping). The linear transform accounted for global inter-subject variability in brain size, shape, and position and included translation, rotation, scale, and shear. For DCT, the nonlinear warps were modeled by a linear combination of discrete cosine-basis functions with low-spatial frequency to reduce the number of parameters to be fitted (Ashburner and Friston, 1999). The optimum coefficients of the basis functions were estimated by minimizing the SSD between the image and template, while simultaneously maximizing the smoothness of the transform within a maximum a posteriori probability (MAP) framework (Ashburner et al., 1997). FFD was implemented with B-spline interpolation, providing local support to model large focal warping (Rueckert et al., 1999; Rueckert et al., 2003). The deformation field was determined by the displacements specified on a lattice of control points, and the displacements that were off the control points were interpolated based on the neighborhood control points using uniform cubic B-splines. NMI was used to measure image similarity during normalization with FFD.
FFD and DCT were applied to all the subjects following the same two-round procedure. Individual brain images were spatially normalized to the widely adopted template ICBM152, which was developed by the International Consortium for Human Brain Mapping (ICBM) and based on the data from 152 normal adult subjects (Mazziotta et al., 1995). Systematic differences in skull size and shape may occur between the ICBM152 template and brain images of pediatric subjects involved in this study (Good et al., 2001b; Wilke et al., 2002); therefore, all of the normalized images were averaged to create a customized high-resolution T1 template. Next, the affine and nonlinear transforms were repeated to register the raw (non-normalized) T1 image of each participant to the customized high-resolution T1 template to achieve optimized spatial normalization. During the second round of spatial normalization, the affine transform would be occasionally stuck at the local maximum for the FFD approach because the high-resolution customized T1 template was used. To reduce the brain structural complexity, non-brain tissues such as skull and scalp were stripped from the image by using Brain Extraction Tool (BET, http://www.fmrib.ox.ac.uk/fsl/bet/index.html) implemented in MRIcro (http://www.sph.sc.edu/ comd/rorden/mricro.html).
Evaluation of spatial normalization
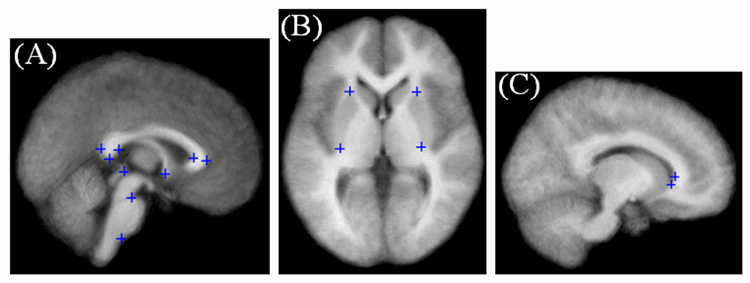
Visual inspection of the mean and standard deviation images of the control and patient groups provided a comparison between FFD and DCT. For further quantitative analysis, we used a set of anatomical landmarks in the subcortical region of the brain. Landmarks were chosen based on similar work by Rueckert et al. (2003). The landmarks included stable anatomical structures such as the corpus callosum, pons, putamen, lateral ventricles, and the anterior and posterior commissures (Fig. 1). Rueckert’s landmarks located at the superior and inferior aspects of the cerebellum and the fourth ventricle were excluded because those positions were directly involved in PFBT resection.
Fig. 1.
Anatomical landmarks used to measure the accuracy of FFD and DCT spatial normalization. Landmarks of the (A) splenium and genu of the corpus callosum, the superior and inferior aspects of the pons, the anterior and posterior commissure; (B) the superior and inferior tip of the putamen (left and right); and (C) the anterior and inferior tips of the lateral ventricles (right hemisphere) are noted by blue crosshairs.
A semiautomatic approach was used to detect the corresponding landmarks on a normalized image and on a matched template (Hartkens, 2003). First, the coarse position of a landmark was selected on both the normalized image and the template. Then potential landmark candidates were detected by applying a 3D differential operator (Rohr, 1997) within a region of interest (ROI) centered at the coarse position. Finally, the corresponding landmarks were determined by selecting the most promising candidate on the normalized image and on the template. The residual error of spatial normalization between corresponding landmarks was also calculated.
The accuracy of spatial normalization was first evaluated in a single representative subject to explore the separate effects of two spatial normalization methods, including the degrees of freedom of the deformation field and the similarity metric. The brain image of a typical PFBT patient with enlarged ventricles and surgical void at the cerebellum was normalized using FFD and DCT respectively. The same customized high-resolution template created as described above was used to eliminate any confounding effect from the template. Both approaches included a 12-parameter affine transform prior to nonlinear warping. We compared the residual errors of the matching landmarks after the 12-parameter affine transform to evaluate the effect of different similarity metrics, NMI for the FFD approach and SSD for the DCT approach.
For non-linear warping, the accuracy of FFD was compared to that of DCT with similar degrees of freedom. For FFD, control lattice spacing distances of 20, 15 and 10 mm were evaluated. These control lattice spacing distances corresponded to the deformation fields with 700, 1960 and 6615 degrees of freedom, respectively. In the DCT approach, dimensionality of the deformation field was determined by the cutoff frequency of the discrete cosine basis functions. Cutoff frequencies of 1/20, 1/15 and 1/10 mm−1, corresponded to 891, 2160 and 7128 degrees of freedom, were evaluated. Landmark matching was performed to quantitatively evaluate the accuracy of two spatial normalization approaches with different degrees of freedom.
To assess the accuracy of spatial normalization across the PFBT and control groups, landmark matching was evaluated in all the subjects after FFD with 6615 degrees of freedom and after DCT with 7128 degrees of freedom. Landmark matching was compared with the Wilcoxon signed rank test.
VBM
After warping all the brain images into a common space, we segmented normalized brain images into gray matter (GM), white matter (WM), and cerebrospinal fluid (CSF). Segmentation was performed using a modified version of the clustering algorithm maximum likelihood “mixture model” with the incorporation of the prior knowledge about the spatial distribution of different tissue types (Ashburner and Friston, 1997). The resulting segments were represented by maps indicating the probability of each voxel being GM, WM, or CSF. Customized prior atlases, which should reflect the characteristic of the population in the study, were used for optimum segmentation. In the first pass of spatial normalization, all the normalized images in both of the PFBT and control groups in the study were segmented based on the standard prior images in SPM2 from normal adults. GM, WM and CSF segments were then averaged and smoothed with an 8 mm Gaussian kernel to make customized GM, WM and CSF prior images. The normalized images in the second pass were segmented based on the customized prior images. After segmentation, the cerebellum was removed from all of the segments. Gaussian-smoothing kernels with full width at half maximum (FWHM) of 0, 4, 8, 12, or 16 mm were evaluated.
Jacobian modulation was used to compensate for volumetric changes introduced by spatial normalization (Ashburner and Friston, 2000). Modulation introduced a weighting factor based on the volume change so that the differences in volume could be examined, in addition to the differences in brain tissue concentration or density derived from the nonmodulated segments. Because this was the first time that FFD was introduced into VBM analysis, we developed a new procedure to modulate the segments. For FFD, spatial normalization was implemented based on uniform cubic B-splines. Therefore, for each voxel in a normalized brain image, the first derivatives of cubic B-splines for each coordinate relative to all three coordinates were calculated with the displacement values estimated during spatial normalization. The derivatives were then assembled into a Jacobian matrix, and the determinant of this matrix was calculated for modulation. The modulated segments were also smoothed with the isotropic Gaussian kernels and made ready for the statistical analysis.
Statistical analyses
Statistical nonParametric Mapping (SnPM) (http://www.sph.umich.edu/ni-stat/SnPM/), which makes no assumption about the distribution properties of statistical maps, was used because high-resolution, T1-weighted images of brain structures are not generally stationary random fields. The t statistic was calculated at each voxel, and the significance was assessed at both the voxel and cluster levels based on 500 permutations. The primary threshold to assess the significance of suprathreshold cluster size was set at t = 4.0, and the family-wise, error-corrected threshold was specified at p = 0.05. Morphological differences are displayed on both the Montreal Neurological Institute (MNI) “glass brain” and the average of normalized T1-weighted images from all subjects in the study. Both MNI coordinates and Talairach coordinates are reported for the regions of significant differences (Chau and McIntosh, 2005). The MNI coordinates were converted into the Talairach space according to the method developed by Matthew Brett at Medical Research Council and Cognitive Brain Unit, University of Cambridge (http://www.mrc-cbu.cam.ac.uk/Imaging/mnispace.html).
Results
Comparison of FFD vs. DCT based on single subject measurement
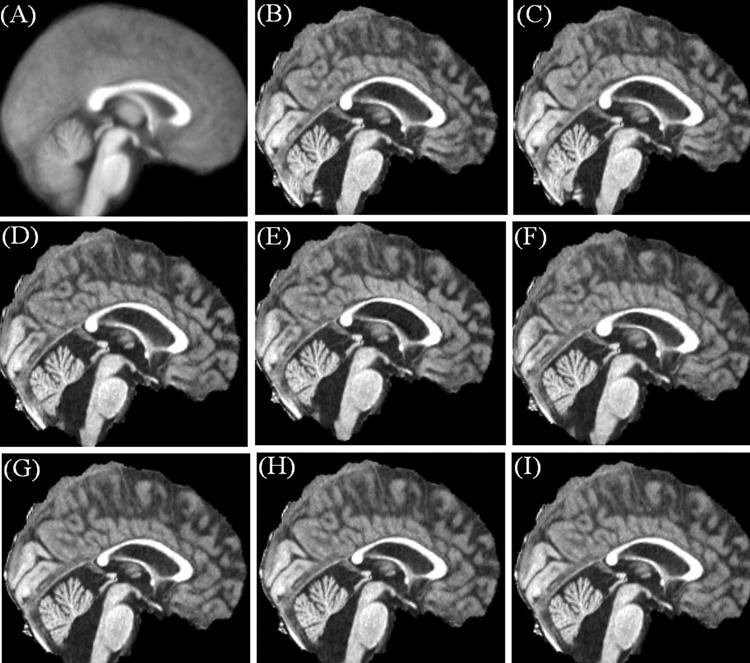
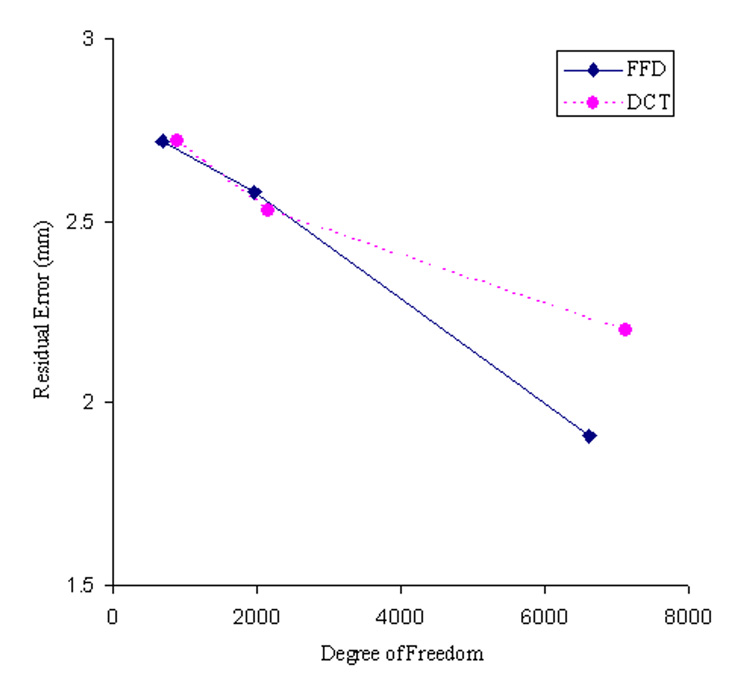
The brain images of a single PFBT patient after affine transform and non-linear warping with different degrees of freedom are shown in Fig. 2, along with the matched template. Following the affine transform that was incorporated in both of the FFD and DCT approaches, the average residual error across all the landmarks was 3.3 mm for FFD processing stream and 3.6 mm for DCT processing stream. The difference in residual errors reflects the different similarity metrics (SSD vs. NMI) used in two processing streams. With non-linear warping, the accuracy of spatial normalization improved with decreasing control lattice spacing distance, reflected by decreasing residual error from 2.7 to 2.6 and then to 1.9 mm with 20, 15 and 10 mm spacing distances respectively (Fig. 3). For DCT, the accuracy of spatial normalization was improved more gradually. The residual errors were 2.7, 2.5 and 2.2 mm with the increasing degrees of freedom. No apparent distortion was observed around the surgical void with either approach.
Fig. 2.
Comparison of the accuracy of the FFD spatial normalization approach with that of the DCT approach in a PFBT survivor with enlarged ventricles and the surgical void in the cerebellum. (A) Customized template. (B) Brain image after the affine transform using the FFD approach. (C) Brain image after the affine transform using the DCT approach. (D)–(F) FFD normalized brain images using the control point spacing distances of 20, 15 and 10 mm. (G)–(I) DCT normalized brain images using the cutoff frequencies of 1/20, 1/15 and 1/10 mm−1.
Fig. 3.
Comparison of the accuracy of FFD and DCT spatial normalization with different degrees of freedom in a typical PFBT survivor using landmark matching.
Comparison of FFD vs. DCT across the PFBT and control groups
The average errors over all the pre-defined landmarks after the FFD spatial normalization (degree of freedom = 6615) were 2.1 mm for the PFBT group and 1.9 mm for the control group (Table 1). In the patient group, the landmarks located at the corpus callosum had the largest errors with the maximum value of 2.5 mm at the outer aspect of the genu. Next were lateral ventricles and putamen with errors between 2.1 and 2.4 mm. Well defined regions with sharp edges such as pons, AC and PC (except the inferior aspect of the pons) showed much smaller errors with the minimum value of 1.5 mm at the AC and PC. Residual errors were smaller in the control group, ranging from 1.4 mm at the superior aspect of the pons to 2.3 mm at the anterior tip of the right lateral ventricle and right putamen.
Table 1.
Accuracy of the FFD and DCT spatial normalization approach based on anatomical landmarks.
| Anatomical Landmark | FFD | DCT | ||
|---|---|---|---|---|
| PFBT Survivorsa | Sibling Controlsa | PFBT Survivorsa | Sibling Controlsa | |
| Splenium of corpus callosum (outer) | 2.3 | 2.0 | 2.8 | 2.4 |
| Splenium of corpus callosum (inferior) | 2.0 | 1.9 | 2.1 | 2.1 |
| Splenium of corpus callosum (inner) | 2.4 | 2.2 | 2.6 | 2.5 |
| Genu of corpus callosum (outer) | 2.5 | 1.7 | 2.6 | 1.7 |
| Genu of corpus callosum (inner) | 2.1 | 2.0 | 2.3 | 2.3 |
| Pons (superior) | 1.7 | 1.4 | 1.7 | 1.4 |
| Pons (inferior) | 2.4 | 2.0 | 2.7 | 2.2 |
| Putamen anterior (left) | 2.2 | 1.9 | 2.5 | 2.3 |
| Putamen posterior (left) | 2.3 | 2.0 | 2.5 | 2.4 |
| Putamen anterior (right) | 2.3 | 2.3 | 2.6 | 2.3 |
| Putamen posterior (right) | 2.2 | 2.3 | 2.5 | 2.4 |
| Anterior commissure | 1.5 | 1.5 | 1.7 | 1.6 |
| Posterior commissure | 1.5 | 1.5 | 1.6 | 1.5 |
| Anterior tip of lateral ventricle (left) | 2.3 | 1.9 | 2.7 | 2.4 |
| Inferior tip of lateral ventricle (left) | 2.3 | 2.1 | 2.5 | 2.2 |
| Anterior tip of lateral ventricle (right) | 2.4 | 2.3 | 2.4 | 2.3 |
| Inferior tip of lateral ventricle (right) | 2.1 | 2.1 | 2.3 | 2.1 |
| All landmarks | 2.1 | 1.9 | 2.4 | 2.1 |
The groups’ average residual normalization errors (in mm) at individual landmarks are shown.
Landmark matching was also applied to evaluate the accuracy of the DCT approach (degree of freedom = 7128). As in the single-subject evaluation, the residual errors were slightly larger with DCT than with FFD (2.4 mm for the PFBT group and 2.1 mm for the control group). For DCT, similar regional distributions of errors were observed as compared to the FFD approach. In the patient group, the residual errors ranged from 1.6 mm at the PC to 2.8 mm at the outer aspect of the splenium of the corpus callosum. In the control group, the superior aspect of the pons had the smallest residual error (1.4 mm) and the inner aspect of splenium of corpus callosum had the largest residual error (2.5 mm). Overall, the residual errors were significantly smaller with the FFD approach than with the DCT approach in both of PFBT ( p = 0.0003) and control (p = 0.0018) groups.
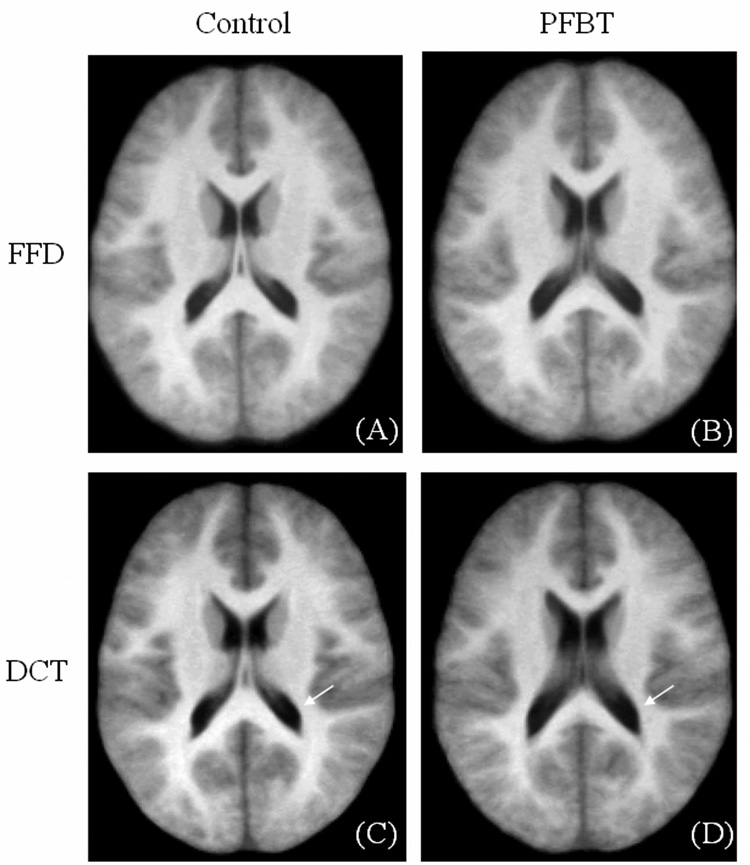
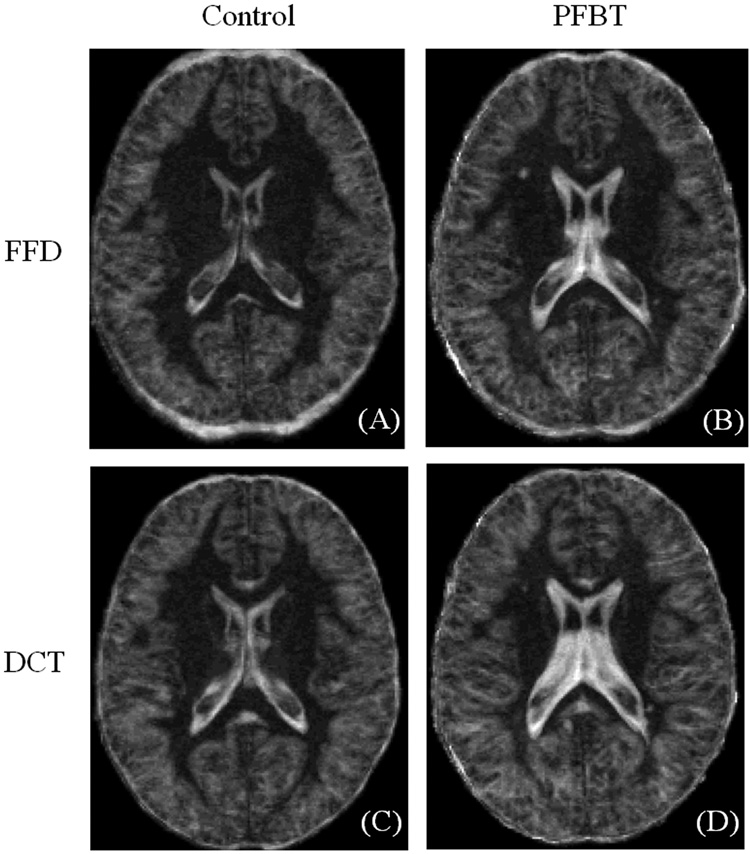
In addition to landmark matching, the mean (Fig. 4) and standard deviation (Fig. 5) images across the PFBT and control groups were created for direct visual comparison between the FFD and DCT approaches. The mean and standard deviation images were scaled to the same brightness and contrast levels. The mean images of the control group from both approaches demonstrated good spatial normalization. The boundaries of lateral ventricles were sharply delimited. In contrast, blurring was observed around the ventricles on the mean images of the PFBT group, implying more residual inter-subject variability for PFBT survivors. Moreover, in contrast to the similarity of the mean images of two groups with FFD, the differences between two groups with DCT were apparent (arrows). Standard deviation images showed differences between FFD and DCT (Fig. 5) that were similar to those seen on the mean images. In the control group, image standard deviation was similar with both FFD and DCT, with slightly higher deviation surrounding the ventricles for DCT. For the PFBT group, the standard deviation image from FFD showed higher variability surrounding the ventricles than in the control, but the size of the ventricles was closer to the normal level than with DCT. Based on the observation from the mean and standard deviation images of two groups with the FFD and DCT approaches, landmarks were further divided into two categories. One category contained landmarks near the ventricles (genu and splenium of the corpus callosum, tips of bilateral ventricles). The other category included the remaining landmarks farther from the ventricles (see Table 1). For landmarks close to the ventricles, the residual errors were significantly smaller with FFD than with DCT for both of the PFBT (p = 0.005) and control group (p = 0.025). For the rest of the landmarks, the residual errors were still significantly smaller with FFD for the PFBT group (p = 0.01) but only marginally smaller for the control group (p = 0.05).
Fig. 4.
Mean images of the PFBT and control groups after FFD and DCT spatial normalization.
Fig. 5.
Standard deviation images of the PFBT and control groups after FFD and DCT spatial normalization.
VBM results
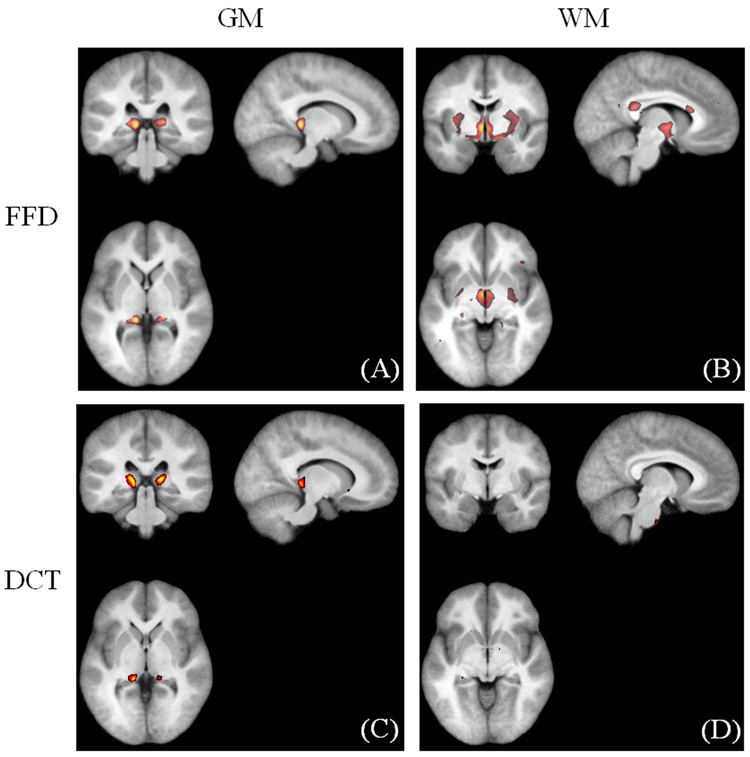
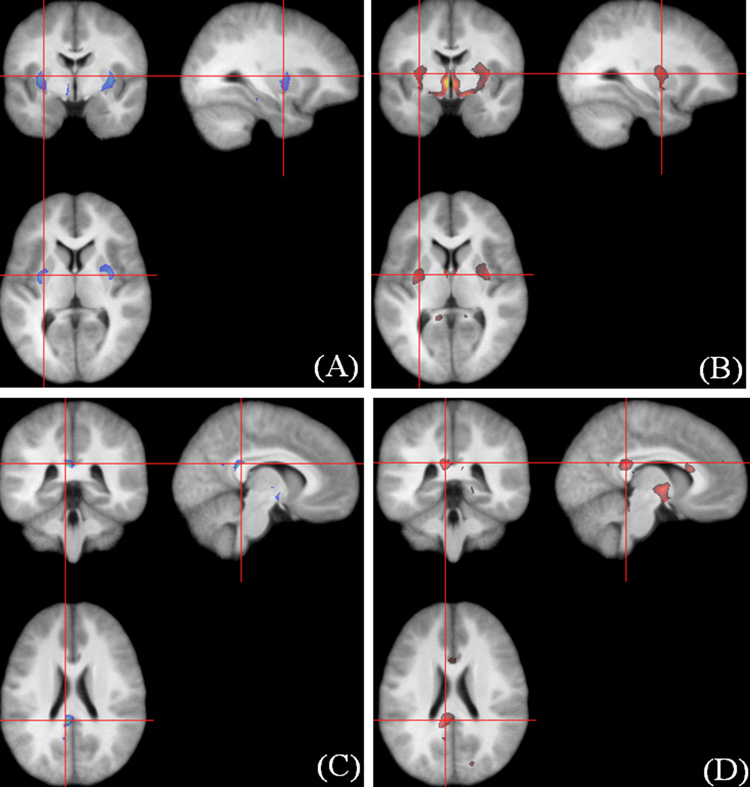
We compared the VBM results derived from the FFD spatial normalization with 6615 degrees of freedom with those from the DCT approach with 7128 degrees of freedom. VBM detected a similar set of regions with decreased GM density in the PFBT groups using both of the FFD (Fig. 6A) and DCT (Fig. 6C) spatial normalization. However, a number of regions with decreased WM density were detected with the FFD normalization (Fig. 6B) but not with the DCT normalization (Fig. 6D). Because the accuracy of spatial normalization was more accurate with FFD than with DCT, the VBM results based on the FFD normalization are reported.
Fig. 6.
Comparison of the VBM results. (A–B) GM and WM differences with the FFD approach. (C–D) GM and WM differences with the DCT approach.
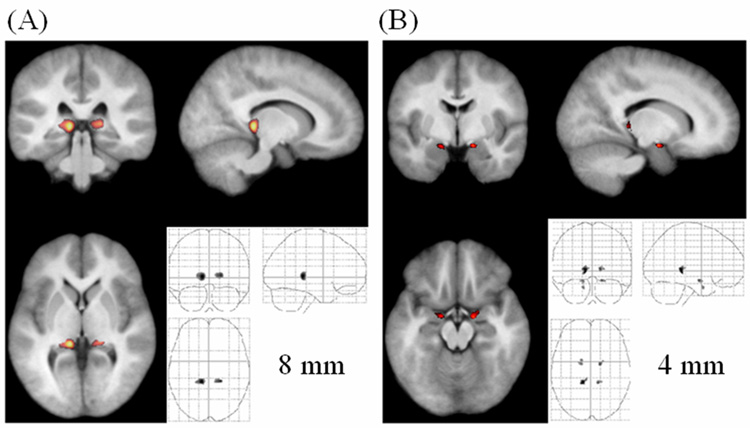
VBM identified significant differences in tissue density in smoothed GM and WM segments on images from PFBT survivors compared to those from sibling controls. With an 8-mm FWHM Gaussian kernel applied, the GM in the bilateral thalamus of PFBT survivors was significantly less dense than that of controls (left: voxel level p = 0.002, cluster level p = 0.018; right: voxel level p = 0.002, cluster level p = 0.034) (Fig. 7A). Using the 4-mm smoothing kernel, we detected 2 additional regions with decreased GM density in the bilateral entorhinal cortex (left: cluster level p = 0.008; right: cluster level p = 0.024) (Fig. 7B). No differences were found in the nonsmoothed GM segments. The 12-mm kernel revealed a difference in the density of GM in the left thalamus, and the 16-mm kernel showed similar densities but an extended region, compared with that seen with the 12-mm kernel (data not shown).
Fig. 7.
Significantly decreased GM density in the PFBT group (unmodulated). (A) Overlay at the bilateral thalamus (pulvinar) (8-mm smoothing kernel). (B) Overlay at the bilateral entorhinal cortex (4-mm smoothing kernel). The anatomical image used for the overlay is the average of all the normalized brain images from both the PFBT and control groups.
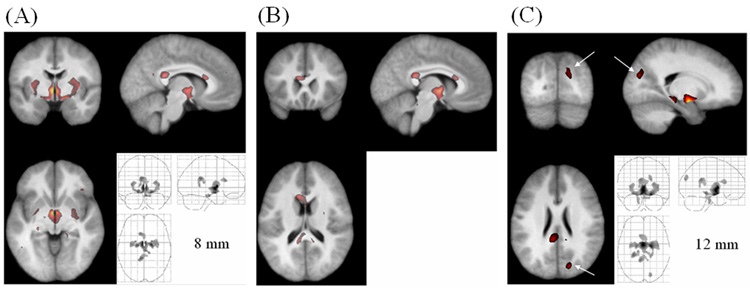
The segments smoothed with the 8-mm kernel showed that the density of WM was also lower in PFBT survivors than in controls in three regions (Fig. 8A–B). The largest region was located in the internal capsule and hypothalamus (voxel level p = 0.002, cluster level p = 0.002). The other two regions were identified in the corpus callosum, one at the splenium (voxel level p = 0.002, cluster level p = 0.002) and the other at the genu (voxel level p = 0.002, cluster level p = 0.006). Similar regions were detected with 4-mm and 12-mm kernels. The smaller kernel resulted in more scattered distribution, and the larger kernel detected more extended clusters. Using the 12-mm kernel, we detected decreased WM density at the cuneus in the occipital lobe (voxel level p = 0.044, cluster level p = 0.032) (Fig. 8C), but this finding disappeared after smoothing with the 16-mm kernel. No significant differences were detected in the nonsmoothed WM segments. The coordinates of all the regions in GM and WM segments are listed in Table 2.
Fig. 8.
Significantly decreased WM density in the PFBT survivor group (unmodulated). (A) Overlay at the internal capsule (8-mm smoothing kernel). (B) Overlay at the corpus callosum (8-mm smoothing kernel). (C) Overlay at the cuneus (arrows) in the occipital lobe (12-mm smoothing kernel). The anatomical image used for the overlay is the average of all the normalized brain images from both the PFBT and control groups.
Table 2.
Coordinates of the regions of significant differences in tissue density after application of a Gaussian-smoothing kernel.a
| Location | Coordinate | |
|---|---|---|
| MNI | Talairach | |
| Gray matter (PFBT<Control) | ||
| Left thalamus | −11, −34, 3 | −11, −33, 4 |
| Right thalamus | 20, −32, 4 | 20, −31, 5 |
| Left entorhinal cortexb | −16, −4, −17 | −16, −5, −14 |
| Right entorhinal cortexb | 16, −5, −16 | 16, −6, −13 |
| Gray matter (PFBT>Control) | ||
| Posterior cingulate | −5, −41, 23 | −5, −39, 23 |
| Left putamen | −32, −5, 6 | −32, −5, 6 |
| Right putamen | 36, −1, 5 | 36, −1, 5 |
| White matter (PFBT<Control) | ||
| Internal capsule | −3, 2, 3 | −3, 2, 3 |
| Splenium of corpus callosum | −7, −42, 22 | −7, −39, 22 |
| Genu of corpus callosum | −9, 22, 19 | −9, 22, 16 |
| Cuneusc | 19, −82, 25 | 19, −78, 27 |
An 8-mm Gaussian-smoothing kernel was applied, unless otherwise noted.
A 4-mm Gaussian-smoothing kernel was applied.
A 12-mm Gaussian-smoothing kernel was applied.
Using the 8-mm smoothing kernel, we identified regions in PFBT survivors with significantly higher GM density in the posterior cingulate (voxel level p = 0.002, cluster level p = 0.038) and bilateral putamen (left: voxel level p = 0.002, cluster level p = 0.006; right: voxel level p = 0.002, cluster level p = 0.006) (Table 2 and Fig. 9). VBM studies using the 4- and 12-mm smoothing kernels produced similar regions of increased GM density that were adjacent to regions with decreased WM density.
Fig. 9.
Coupled GM and WM differences. The regions of increased density of GM in the putamen (A, blue area) paired with those of decreased WM density in the internal capsule (B, red area) on images from the PFBT group. The increased GM density region in the posterior cingulate (C, blue area) attached to the decreased WM density regions in the splenium of corpus callosum (D, red area). The red crosshairs indicate the corresponding positions on the images.
Modulated GM and WM segments were smoothed with the 8-mm kernel only. Regions of significant differences were largely reduced in size after adjustment for volume changes. For example, we identified bilateral differences in the GM density of the thalamus on nonmodulated segments, but on modulated segments, the significant decrease on images from PFBT survivors was observed only in the left thalamus. Significant decreases in WM on PFBT survivor images after modulation were similar to the regions with increased GM density that were detected without modulation (data not shown).
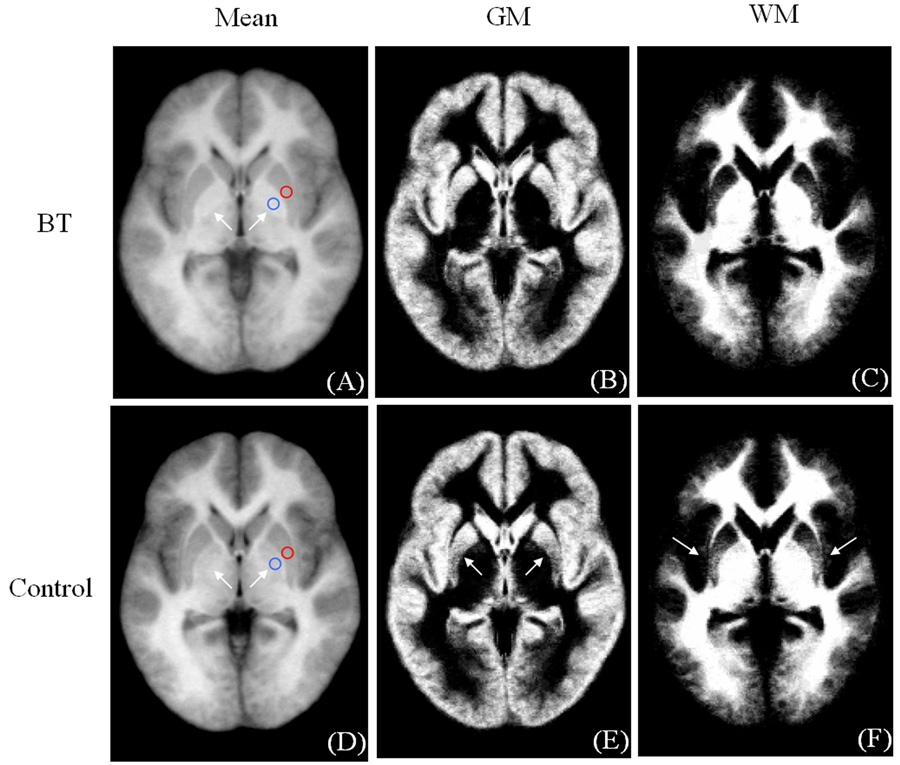
We observed an apparent coupling between increased GM density and decreased WM in the putamen and posterior cingulate. To investigate this, a post-hoc analysis was conducted using the unsmoothed data. Mean images of the FFD-normalized brain images, GM and WM segments were created for both the PFBT and control groups (Fig. 10). Between the PFBT and control groups, GM density in the mean images was similar in the putamen based on the ROI (red circles) analysis (49.7 ± 0.7 for patients and 50.2 ± 0.7 for controls, arbitrary unit). In addition, we note that the globus pallidus (arrows), was visibly brighter in the patients than in the controls, but this difference was not detected by the VBM analysis. ROI (blue circles) analysis confirmed the signal intensity difference in the globus palladus (59.7 ± 0.9 in patients and 55.2 ± 0.6 in controls, arbitrary unit).
Fig. 10.
Mean images of the FFD-normalized whole brain images, GM and WM segments from the PFBT (A–C) and control groups (D–F) with ROIs in the putamen and globus pallidus.
Discussion
FFD-based spatial normalization was more accurate than DCT-based normalization in matching individual brain images from long-term survivors of childhood PFBT to a common template. VBM of FFD-normalized images identified significant morphological lesions in the GM and WM in the supratentorial brain, distant from the site of tumor resection. These abnormalities may help localize the neural substrates of the cognitive deficits that adversely affect the quality of life for these children. The improved spatial normalization that we demonstrated with FFD will facilitate the analysis and interpretation of functional imaging studies designed to investigate the relationships between morphological abnormalities and brain function in patients surviving childhood brain tumors (Zou et al., 2005). Systematic GM lesions in the supratentorial brain, which have not been reported previously, were detected in the pulvinar of the thalamus and in the entorhinal cortex. These regions are exposed to a relatively high dose of radiation during therapy (Murthy et al., 2003). The pulvinar of the thalamus receives inputs from the retina, superior colliculus, and secondary visual cortex and projects outputs to the parietal-occipital-temporal association cortex (Bender, 1981). According to the Thalamic Connectivity Atlas, the thalamic regions identified by VBM are most likely connected to the temporal and occipital cortices (Behrens et al., 2003; Johansen-Berg et al., 2005). The entorhinal cortex is an important memory center that receives input from various cortical areas, including the associational, perirhinal, parahippocampal, and prefrontal cortices, and projects to the dentate gyrus, hippocampus, and subiculum (Van Hoesen et al., 1975; Van Hoesen and Pandya, 1975a; Van Hoesen and Pandya, 1975b). The entorhinal cortex provides the main source of input, through the perforant path, to the hippocampus, which functions in memory acquisition.
The WM abnormalities identified in this study are consistent with the previous ROI-based findings in PFBT survivors (Palmer et al., 2002; Reddick et al., 2003; Reddick et al., 2005). A region of high variability beneath the corpus callosum and associated with the third ventricle was observed, even on the spatially normalized images of the PFBT group, implying that the morphological differences identified in WM could be caused, at least in part, by the residual effects of enlarged ventricles. Palmer and colleagues reported abnormal development of the corpus callosum, especially the splenium, in brain tumor survivors receiving high-dose CRT, thus providing another possible explanation for WM damage (Palmer et al., 2002). According to Hofer and Frahm’s revised vertical corpus callosum partitions, the WM damage that we detected in the corpus callosum was located in Region II, which contains fibers projecting into the premotor and supplementary motor areas (Hofer and Frahm, 2006); the other corpus callosum damage was located in Region V, which is connected to the parietal lobe.
The coupling between increased GM density and decreased WM density in the putamen occurred at the boundary zones between GM and WM; therefore, it may be caused by the inverse relationship between GM and WM in brain parenchyma that is detected after segmentation with smoothing. The area detected by VBM lies in the striated part of the putamen that has nearly equal likelihood of being gray or white matter. ROI analysis in the unsmoothed images demonstrated that there was nearly no signal intensity difference in the putamen prior to segmentation. Therefore, the coupled differences detected probably represent a single lesion that shifted the balance toward higher gray matter in patients and higher white matter in controls. It is noteworthy that the obvious signal intensity difference in the globus pallidus was not detected by VBM. This discrepancy probably reflects the heterogeneity of this region on the prior probability maps which decreases the statistical difference corresponding to the clear signal intensity difference. The globus pallidus signal intensity changes are consistent with increased iron deposition in patients (Haacke et al., 2005; Ogg et al., 1999). This finding points to a limitation of VBM, and identifies an additional area for investigation of the neural sequella of PFBT.
Modulation with the Jacobian determinant adjusted the probability maps of GM and WM segments based on volume changes during normalization. Generally, spatial normalization increased the brain size due to the larger brains on both the standard ICBM152 template and customized templates compared to those on raw images. Therefore, the probability values in GM and WM segments were decreased overall by modulation to compensate for the increased volumes. Moreover, the multiplication of GM and WM segments with volume changes different for individual subjects introduced more inter-subject variation within both study groups. The purpose of modulation is to account for differences in brain tissue volume that are reflected in the deformation field. Significant differences that become apparent only after modulation can be attributed to systematic differences in brain tissue volume. However, if differences exist in both brain tissue density and volume at the same location, the overall results become complicated. Furthermore, reduced differences demonstrated by both voxel-level statistics and suprathreshold cluster size do not necessarily imply an opposite relationship between the differences in density and volume, which may be simply caused by the reduced statistics.
Although the primary goal of this study was achieved, some limitations and interesting issues should be noted. We were interested in detecting morphological differences in gray and white matter that might give insight into the cognitive deficits that affect this patient population. Both VBM and deformation-based morphometry (DBM) may be useful for this purpose (Ashburner et al., 1998). As articulated by Asburner and Friston (Ashburner and Friston, 2000), the purpose of VBM is to detect systematic residual morphological differences between groups following normalization to remove gross inter-subject variation. In contrast, DBM is intended to characterize the deformations that are required to remove inter-subject differences between subjects. We used VBM in this study because we believed that DBM in these patients would be dominated by gross morphological abnormalities in the brain tumor survivors (e.g., large ventricles and surgical voids) that were not of interest in this study.
Currently, VBM is based on a single imaging modality. In this study, only T1-weighted MR images were investigated. Therefore, the success of VBM largely depends on the extent to which the brain structural abnormalities can be contrasted with this single-imaging modality. Reddick and colleagues have demonstrated the benefit of using multiple contrast images such as T1-weighted, T2-weighted, FLAIR, and proton density–weighted MR images to investigate morphological abnormalities (Reddick et al., 2003; Reddick et al., 2005) in cancer survivors. VBM analysis of a multi-contrast image data set may provide a more sensitive and specific tool for identifying morphological abnormalities in this patient population. Recent development in MRI technology such as higher magnetic field strength, multi-channel receivers, and parallel-imaging techniques may make it possible to acquire high-resolution, multi-contrast data sets in an acceptable amount of time.
This study focused on the comparison of the two widely used spatial normalization approaches that have been implemented in public domain software packages. The accuracy of spatial normalization was quantified with pre-defined landmarks. The residual errors in the landmarks were significantly smaller with FFD than with DCT for both of the PFBT and control groups. Our results demonstrate that the FFD normalization is substantially better for the PBFT patients in this study, and suggest that the FFD approach should be considered in any population with abnormalities which require large focal warping.
A disadvantage of the FFD approach is high computational cost for spatial normalization. We set the spacing distance of the control lattice used for the FFD spatial normalization to 10 mm in this study. The accuracy of spatial normalization could be increased by reducing the spacing distance. However, a higher density of control points increases the computational burden substantially. The processing was done on a workstation with 2.6GHz dual core AMD Opteron processors running the Linux operating system and required more than 10 hours per subject with 10-mm control point spacing distance. The computationally-expensive FFD approach was essential for our patients with significant focal abnormalities. But normalization was also slightly better in the control group. The potential benefit of FFD in subjects without significant focal abnormalities depends on the nature of the morphological differences that are anticipated.
In this study, a customized pediatric brain template along with GM, WM and CSF prior images was developed based on the standard ICBM152 template derived from normal adults. We did not use a pediatric brain template (Wilke et al., 2002) during the first round of spatial normalization to avoid secondary derivation of our customized template from another template which was derived from the ICBM standard. This approach creates the potential for systematic bias in the segmentation because of morphometric differences between pediatric and adult brains. However, we know of no prior probability maps for GM, WM and CSF in the pediatric brain that were not derived from adult templates, therefore the customized approach used here affords a reasonable comparison of brain morphology between the groups in this study.
The optimal size of the smoothing kernel should match that of the expected morphological differences, according to the Matched Filter Theorem (Rosenfeld and Kak, 1982). However, the size of the expected morphological differences is seldom known beforehand. Jones and colleagues reported different conclusions about the same patient-control comparison when different smoothing kernel sizes were applied in a VBM analysis of DTI data (Jones et al., 2005). The importance of matched filtering was clear in our VBM analysis of T1-weighted images. The size of regions of morphological difference between patients and controls was highly variable and could not be predicted a priori. Therefore, regions with significant morphological differences were detected with different sizes of smoothing kernels in both GM and WM. These results suggest that a careful exploration of the smoothing kernel size should be conducted, unless one knows the expected cluster size. In our study, comparison of different smoothing kernel sizes constitutes multiple comparison of the data. We know of no methods to correct our statistical threshold to account for the comparison with SnPM. However, most of the VBM findings would survive even with a conservative Bonferroni corrected threshold (p = 0.01).
One constraint on performing a permutation test is the time-consuming computation required for a large number of possible allocations. When performing all possible allocations is not feasible, a subsample of allocations, including the actual allocation, can be done; such a test is called an “approximate permutation test” (Nichols and Holmes, 2002). It should be noted that the approximate permutation test involves a trade off, i.e., its benefit lies in that it decreases computation time and its disadvantage lies in its decreased statistical power. In this study, we compared 500 permutations and 1000 permutations. VBM with 1000 permutations yielded no more significant regions than with 500 permutations.
Conclusion
This research demonstrated that when imaging PFBT survivors with enlarged ventricles or surgical lesions, the FFD approach provides more accurate spatial normalization than does the DCT approach. VBM analysis of FFD-normalized images revealed morphological lesions that may indicate neural substrates of cognitive deficits in childhood brain tumor survivors.
Acknowledgements
This work was supported in part by the National Institute of Child Health and Human Development (HD049888), the Pediatric Brain Tumor Foundation of the United States, the National Cancer Institute (CA23944 and Cancer Center Support grant CA21765), and the American Lebanese Syrian Associated Charities (ALSAC). We thank the children who participated in the study.
Footnotes
Publisher's Disclaimer: This is a PDF file of an unedited manuscript that has been accepted for publication. As a service to our customers we are providing this early version of the manuscript. The manuscript will undergo copyediting, typesetting, and review of the resulting proof before it is published in its final citable form. Please note that during the production process errors may be discovered which could affect the content, and all legal disclaimers that apply to the journal pertain.
References
- Ashburner J, Friston KJ. Multimodal image coregistration and partitioning--a unified framework. Neuroimage. 1997;6:209–217. doi: 10.1006/nimg.1997.0290. [DOI] [PubMed] [Google Scholar]
- Ashburner J, Friston KJ. Nonlinear spatial normalization using basis functions. Hum. Brain Mapp. 1999;7:254–266. doi: 10.1002/(SICI)1097-0193(1999)7:4<254::AID-HBM4>3.0.CO;2-G. [DOI] [PMC free article] [PubMed] [Google Scholar]
- Ashburner J, Friston KJ. Voxel-based morphometry--the methods. Neuroimage. 2000;11:805–821. doi: 10.1006/nimg.2000.0582. [DOI] [PubMed] [Google Scholar]
- Ashburner J, Friston KJ. Why voxel-based morphometry should be used. Neuroimage. 2001;14:1238–1243. doi: 10.1006/nimg.2001.0961. [DOI] [PubMed] [Google Scholar]
- Ashburner J, Hutton C, Frackowiak R, Johnsrude I, Price C, Friston K. Identifying global anatomical differences: deformation-based morphometry. Hum. Brain Mapp. 1988;6:348–357. doi: 10.1002/(SICI)1097-0193(1998)6:5/6<348::AID-HBM4>3.0.CO;2-P. [DOI] [PMC free article] [PubMed] [Google Scholar]
- Ashburner J, Neelin P, Collins DL, Evans A, Friston K. Incorporating prior knowledge into image registration. Neuroimage. 1997;6:344–352. doi: 10.1006/nimg.1997.0299. [DOI] [PubMed] [Google Scholar]
- Behrens TE, Johansen-Berg H, Woolrich MW, Smith SM, Wheeler-Kingshott CA, Boulby PA, Barker GJ, Sillery EL, Sheehan K, Ciccarelli O, Thompson AJ, Brady JM, Matthews PM. Non-invasive mapping of connections between human thalamus and cortex using diffusion imaging. Nat. Neurosci. 2003;6:750–757. doi: 10.1038/nn1075. [DOI] [PubMed] [Google Scholar]
- Bender DB. Retinotopic organization of macaque pulvinar. J. Neurophysiol. 1981;46:672–693. doi: 10.1152/jn.1981.46.3.672. [DOI] [PubMed] [Google Scholar]
- Brett M, Leff AP, Rorden C, Ashburner J. Spatial normalization of brain images with focal lesions using cost function masking. Neuroimage. 2001;14:486–500. doi: 10.1006/nimg.2001.0845. [DOI] [PubMed] [Google Scholar]
- Chau W, McIntosh AR. The Talairach coordinate of a point in the MNI space: how to interpret it. Neuroimage. 2005;25:408–416. doi: 10.1016/j.neuroimage.2004.12.007. [DOI] [PubMed] [Google Scholar]
- Copeland DR, Fletcher JM, Pfefferbaum-Levine B, Jaffe N, Ried H, Maor M. Neuropsychological sequelae of childhood cancer in long-term survivors. Pediatr. 1985;75:745–753. [PubMed] [Google Scholar]
- Good CD, Johnsrude I, Ashburner J, Henson RN, Friston KJ, Frackowiak RS. Cerebral asymmetry and the effects of sex and handedness on brain structure: a voxel-based morphometric analysis of 465 normal adult human brains. Neuroimage. 2001a;14:685–700. doi: 10.1006/nimg.2001.0857. [DOI] [PubMed] [Google Scholar]
- Good CD, Johnsrude IS, Ashburner J, Henson RN, Friston KJ, Frackowiak RS. A voxel-based morphometric study of ageing in 465 normal adult human brains. Neuroimage. 2001b;14:21–36. doi: 10.1006/nimg.2001.0786. [DOI] [PubMed] [Google Scholar]
- Haacke EM, Cheng NY, House MJ, Liu Q, Neelavalli J, Ogg RJ, Khan A, Ayaz M, Kirsch W, Obenaus A. Imaging iron stores in the brain using magnetic resonance imaging. Magn Reson. Imaging. 2005;23:1–25. doi: 10.1016/j.mri.2004.10.001. [DOI] [PubMed] [Google Scholar]
- Hartkens T. PhD Dissertation. London: King's College; 2003. Measuring, analysing, and visualising brain deformation using non-rigid registration. [Google Scholar]
- Helton KJ, Edwards M, Steen RG, Merchant TE, Sapp MV, Boop FA, Langston J. Neuroimaging-detected late transient treatment-induced lesions in pediatric patients with brain tumors. J. Neurosurg. 2005;102:179–186. doi: 10.3171/jns.2005.102.2.0179. [DOI] [PubMed] [Google Scholar]
- Hofer S, Frahm J. Topography of the human corpus callosum revisited--comprehensive fiber tractography using diffusion tensor magnetic resonance imaging. Neuroimage. 2006;32:989–994. doi: 10.1016/j.neuroimage.2006.05.044. [DOI] [PubMed] [Google Scholar]
- Johansen-Berg H, Behrens TE, Sillery E, Ciccarelli O, Thompson AJ, Smith SM, Matthews PM. Functional-anatomical validation and individual variation of diffusion tractography-based segmentation of the human thalamus. Cereb. Cortex. 2005;15:31–39. doi: 10.1093/cercor/bhh105. [DOI] [PubMed] [Google Scholar]
- Jones DK, Symms MR, Cercignani M, Howard RJ. The effect of filter size on VBM analyses of DT-MRI data. Neuroimage. 2005;26:546–554. doi: 10.1016/j.neuroimage.2005.02.013. [DOI] [PubMed] [Google Scholar]
- Konczak J, Schoch B, Dimitrova A, Gizewski E, Timmann D. Functional recovery of children and adolescents after cerebellar tumour resection. Brain. 2005;128:1428–1441. doi: 10.1093/brain/awh385. [DOI] [PubMed] [Google Scholar]
- Macedoni-Luksic M, Jereb B, Todorovski L. Long-term sequelae in children treated for brain tumors: impairments, disability, and handicap. Pediatr. Hematol. Oncol. 2003;20:89–101. doi: 10.1080/0880010390158595. [DOI] [PubMed] [Google Scholar]
- Mazziotta JC, Toga AW, Evans A, Fox P, Lancaster J. A probabilistic atlas of the human brain: theory and rationale for its development. The International Consortium for Brain Mapping (ICBM) Neuroimage. 1995;2:89–101. doi: 10.1006/nimg.1995.1012. [DOI] [PubMed] [Google Scholar]
- Mulhern RK, Kovnar EH, Kun LE, Crisco JJ, Williams JM. Psychologic and neurologic function following treatment for childhood temporal lobe astrocytoma. J Child Neurol. 1988;3:47–52. doi: 10.1177/088307388800300111. [DOI] [PubMed] [Google Scholar]
- Mulhern RK, Merchant TE, Gajjar A, Reddick WE, Kun LE. Late neurocognitive sequelae in survivors of brain tumours in childhood. Lancet Oncol. 2004;5:399–408. doi: 10.1016/S1470-2045(04)01507-4. [DOI] [PubMed] [Google Scholar]
- Mulhern RK, Palmer SL, Reddick WE, Glass JO, Kun LE, Taylor J, Langston J, Gajjar A. Risks of young age for selected neurocognitive deficits in medulloblastoma are associated with white matter loss. J Clin Oncol. 2001;19:472–479. doi: 10.1200/JCO.2001.19.2.472. [DOI] [PubMed] [Google Scholar]
- Mulhern RK, Reddick WE, Palmer SL, Glass JO, Elkin TD, Kun LE, Taylor J, Langston J, Gajjar A. Neurocognitive deficits in medulloblastoma survivors and white matter loss. Ann Neurol. 1999;46:834–841. doi: 10.1002/1531-8249(199912)46:6<834::aid-ana5>3.0.co;2-m. [DOI] [PubMed] [Google Scholar]
- Murthy V, Jalali R, Sarin R, Nehru RM, Deshpande D, Dinshaw KA. Stereotactic conformal radiotherapy for posterior fossa tumours: a modelling study for potential improvement in therapeutic ratio. Radiother. Oncol. 2003;67:191–198. doi: 10.1016/s0167-8140(03)00009-4. [DOI] [PubMed] [Google Scholar]
- Nichols TE, Holmes AP. Nonparametric permutation tests for functional neuroimaging: a primer with examples. Hum Brain Mapp. 2002;15:1–25. doi: 10.1002/hbm.1058. [DOI] [PMC free article] [PubMed] [Google Scholar]
- Ogg RJ, Langston JW, Haacke EM, Steen RG, Taylor JS. The correlation between phase shifts in gradient-echo MR images and regional brain iron concentration. Magn Reson. Imaging. 1999;17:1141–1148. doi: 10.1016/s0730-725x(99)00017-x. [DOI] [PubMed] [Google Scholar]
- Palmer SL, Goloubeva O, Reddick WE, Glass JO, Gajjar A, Kun L, Merchant TE, Mulhern RK. Patterns of intellectual development among survivors of pediatric medulloblastoma: a longitudinal analysis. J. Clin. Oncol. 2001;19:2302–2308. doi: 10.1200/JCO.2001.19.8.2302. [DOI] [PubMed] [Google Scholar]
- Palmer SL, Reddick WE, Glass JO, Gajjar A, Goloubeva O, Mulhern RK. Decline in corpus callosum volume among pediatric patients with medulloblastoma: longitudinal MR imaging study. AJNR Am J Neuroradiol. 2002;23:1088–1094. [PMC free article] [PubMed] [Google Scholar]
- Phillips NS, Sanford RA, Helton KJ, Boop FA, Zou P, Tekautz T, Gajjar A, Ogg RJ. Diffusion tensor imaging of intraaxial tumors at the cervicomedullary and pontomedullary junctions. Report of two cases. J. Neurosurg. 2005;103:557–562. doi: 10.3171/ped.2005.103.6.0557. [DOI] [PubMed] [Google Scholar]
- Reddick WE, Glass JO, Palmer SL, Wu S, Gajjar A, Langston JW, Kun LE, Xiong X, Mulhern RK. Atypical white matter volume development in children following craniospinal irradiation. Neuro-oncol. 2005;7:12–19. doi: 10.1215/S1152851704000079. [DOI] [PMC free article] [PubMed] [Google Scholar]
- Reddick WE, White HA, Glass JO, Wheeler GC, Thompson SJ, Gajjar A, Leigh L, Mulhern RK. Developmental model relating white matter volume to neurocognitive deficits in pediatric brain tumor survivors. Cancer. 2003;97:2512–2519. doi: 10.1002/cncr.11355. [DOI] [PubMed] [Google Scholar]
- Reeves CB, Palmer SL, Reddick WE, Merchant TE, Buchanan GM, Gajjar A, Mulhern RK. Attention and memory functioning among pediatric patients with medulloblastoma. J. Pediatr. Psychol. 2006;31:272–280. doi: 10.1093/jpepsy/jsj019. [DOI] [PubMed] [Google Scholar]
- Ries ML, Boop FA, Griebel ML, Zou P, Phillips NS, Johnson SC, Williams JP, Helton KJ, Ogg RJ. Functional MRI and Wada determination of language lateralization: a case of crossed dominance. Epilepsia. 2004;45:85–89. doi: 10.1111/j.0013-9580.2004.04403.x. [DOI] [PubMed] [Google Scholar]
- Rohr K. On 3D differential operators for detecting point landmark. J Image Vision Computing. 1997;15:219–233. [Google Scholar]
- Rosenfeld A, Kak AC. Digital Picture Processing, Volume 2. Orlando: Academic Press; 1982. [Google Scholar]
- Rueckert D, Frangi AF, Schnabel JA. Automatic construction of 3-D statistical deformation models of the brain using nonrigid registration. IEEE Trans. Med. Imaging. 2003;22:1014–1025. doi: 10.1109/TMI.2003.815865. [DOI] [PubMed] [Google Scholar]
- Rueckert D, Sonoda LI, Hayes C, Hill DL, Leach MO, Hawkes DJ. Nonrigid registration using free-form deformations: application to breast MR images. IEEE Trans. Med. Imaging. 1999;18:712–721. doi: 10.1109/42.796284. [DOI] [PubMed] [Google Scholar]
- Steen RG, Koury BSM, Granja CI, Xiong X, Wu S, Glass JO, Mulhern RK, Kun LE, Merchant TE. Effect of ionizing radiation on the human brain: white matter and gray matter T1 in pediatric brain tumor patients treated with conformal radiation therapy. Int. J. Radiat. Oncol. Biol. Phys. 2001;49:79–91. doi: 10.1016/s0360-3016(00)01351-1. [DOI] [PubMed] [Google Scholar]
- Steinlin M, Imfeld S, Zulauf P, Boltshauser E, Lovblad KO, Ridolfi LA, Perrig W, Kaufmann F. Neuropsychological long-term sequelae after posterior fossa tumour resection during childhood. Brain. 2003;126:1998–2008. doi: 10.1093/brain/awg195. [DOI] [PubMed] [Google Scholar]
- Studholme C, Hill DL, Hawkes DJ. Automated three-dimensional registration of magnetic resonance and positron emission tomography brain images by multiresolution optimization of voxel similarity measures. Med. Phys. 1997;24:25–35. doi: 10.1118/1.598130. [DOI] [PubMed] [Google Scholar]
- Van Hoesen G, Pandya DN. Some connections of the entorhinal (area 28) and perirhinal (area 35) cortices of the rhesus monkey. I. Temporal lobe afferents. Brain Res. 1975a;95:1–24. doi: 10.1016/0006-8993(75)90204-8. [DOI] [PubMed] [Google Scholar]
- Van Hoesen G, Pandya DN, Butters N. Some connections of the entorhinal (area 28) and perirhinal (area 35) cortices of the rhesus monkey. II Frontal lobe afferents. Brain Res. 1975;95:25–38. doi: 10.1016/0006-8993(75)90205-x. [DOI] [PubMed] [Google Scholar]
- Van Hoesen GW, Pandya DN. Some connections of the entorhinal (area 28) and perirhinal (area 35) cortices of the rhesus monkey. III. Efferent connections. Brain Res. 1975b;95:39–59. doi: 10.1016/0006-8993(75)90206-1. [DOI] [PubMed] [Google Scholar]
- Wilke M, Schmithorst VJ, Holland SK. Assessment of spatial normalization of whole-brain magnetic resonance images in children. Hum Brain Mapp. 2002;17:48–60. doi: 10.1002/hbm.10053. [DOI] [PMC free article] [PubMed] [Google Scholar]
- Wright IC, McGuire PK, Poline JB, Travere JM, Murray RM, Frith CD, Frackowiak RS, Friston KJ. A voxel-based method for the statistical analysis of gray and white matter density applied to schizophrenia. Neuroimage. 1995;2:244–252. doi: 10.1006/nimg.1995.1032. [DOI] [PubMed] [Google Scholar]
- Zou P, Mulhern RK, Butler RW, Li CS, Langston JW, Ogg RJ. BOLD responses to visual stimulation in survivors of childhood cancer. Neuroimage. 2005;24:61–69. doi: 10.1016/j.neuroimage.2004.08.030. [DOI] [PubMed] [Google Scholar]


