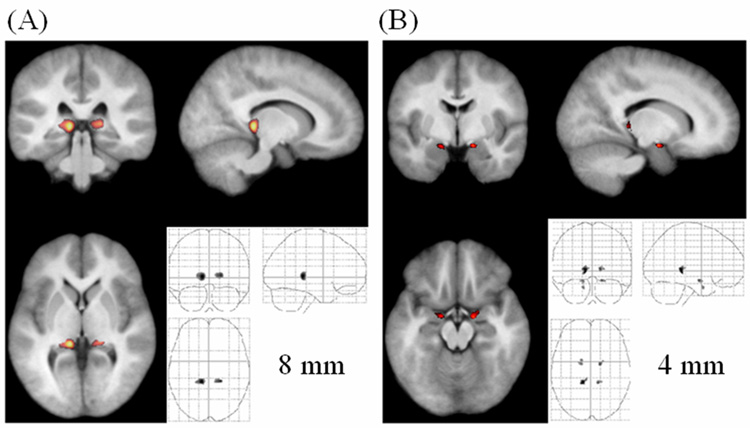
Fig. 7.
Significantly decreased GM density in the PFBT group (unmodulated). (A) Overlay at the bilateral thalamus (pulvinar) (8-mm smoothing kernel). (B) Overlay at the bilateral entorhinal cortex (4-mm smoothing kernel). The anatomical image used for the overlay is the average of all the normalized brain images from both the PFBT and control groups.

