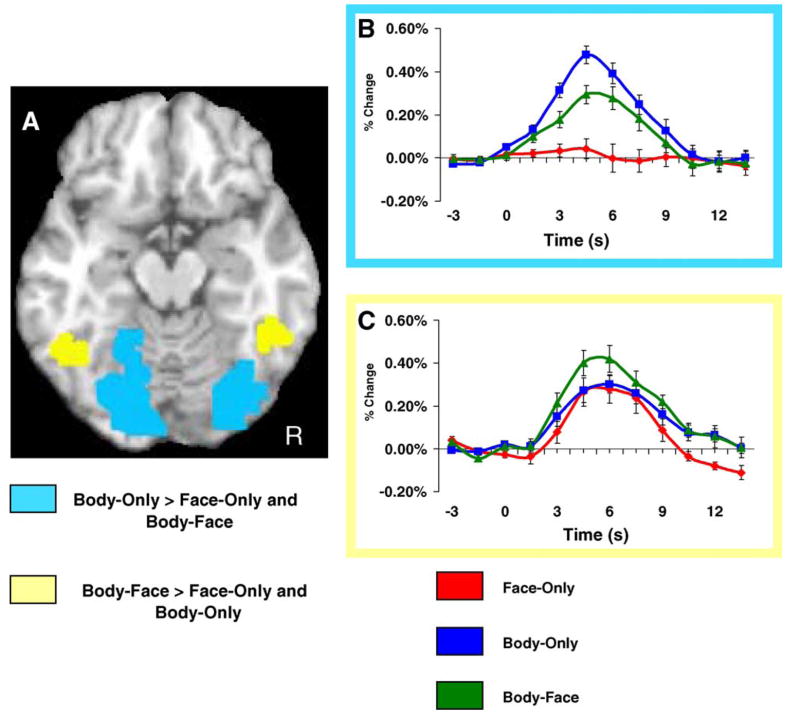
Fig. 5.
Ventral occipitotemporal activation. Panel A shows two different regions of interest in the VOTC. The light-blue color map displays voxels that responded significantly stronger for Face-Only trials compared to both Body-Only and Body-Face trials in a random-effects analysis that was employed to identify regions of interest. The yellow color map displays voxels that responded significantly stronger for Body-Face trials compared to both Body-Only and Face-Only trials. Panel B displays the average HDR from the voxels displayed in the light blue color map. The HDR was independently sampled from a separate subset of trials that were used to define the functional region of interest. The average peak amplitude varied as a function of stimulus condition. Specifically, Body-Only trials evoked a larger peak amplitude response than that evoked by both Face-Only and Body-Face trials (p < .05). Body-Face trials evoked a significantly larger peak response compared to Face-Only trials (p < .01). Panel C displays the average HDR from the voxels displayed in the yellow color map. The HDR was independently sampled from a separate subset of trials that were used to define the functional region of interest. The average peak amplitude varied as a function of stimulus condition. Specifically, Body-Face trials evoked a larger peak amplitude response than both Body-Only and Face-Only conditions (p < .05). There was no difference between Body-Only and Face-Only trials.

